Dogecoin Market Analysis
Dogecoin 시장 분석
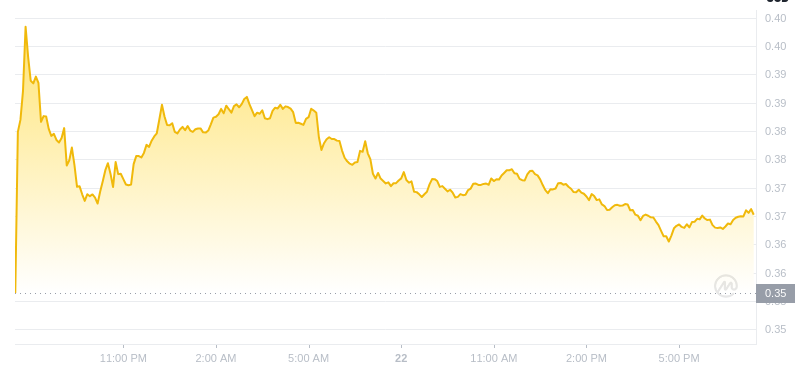
Dogecoin (DOGE), the renowned meme coin, has experienced significant market volatility. Its current value is approximately $0.1246, representing a 2.13% rise from the previous day. Despite this increase, DOGE faced an 8.88% decline last week.
유명한 밈 코인인 도지코인(DOGE)은 상당한 시장 변동성을 경험했습니다. 현재 가치는 약 $0.1246으로 전날보다 2.13% 상승했습니다. 이러한 증가에도 불구하고 DOGE는 지난주 8.88% 하락을 겪었습니다.
Ranked eighth in market capitalization at nearly $18 billion, Dogecoin's 24-hour trading volume has decreased by 28% to approximately $456 million. This volatility highlights the ongoing competition between buyers and sellers.
시가총액 8위인 약 180억 달러에 달하는 Dogecoin의 24시간 거래량은 약 4억 5,600만 달러로 28% 감소했습니다. 이러한 변동성은 구매자와 판매자 간의 지속적인 경쟁을 강조합니다.
Weekly and Monthly Performance
주간 및 월간 실적
Over the past week, Dogecoin's value fluctuated between $0.12 and $0.14, indicating persistent volatility. The struggle between optimistic and pessimistic attitudes is evident in this instability.
지난 주 동안 Dogecoin의 가치는 0.12달러에서 0.14달러 사이를 오가며 지속적인 변동성을 나타냈습니다. 낙관적인 태도와 비관적인 태도 사이의 투쟁은 이러한 불안정성에서 분명하게 드러납니다.
Long-term, DOGE has declined by 22% in the past month. Sustained selling pressure has intensified this fall from the crucial $0.15 level.
장기적으로 DOGE는 지난 한 달 동안 22% 감소했습니다. 지속적인 매도 압력은 이번 가을 중요한 $0.15 수준에서 더욱 강화되었습니다.
Significant Activity
중요한 활동
Data from IntoTheBlock suggests that Dogecoin has witnessed significant activity, with 6.93 billion coins traded in a single day. This activity includes a 2.35% increase in large transactions, hinting at a slight upward trend.
IntoTheBlock의 데이터에 따르면 Dogecoin은 하루에 69억 3천만 개의 코인이 거래되는 등 상당한 활동을 목격했습니다. 이 활동에는 대규모 거래의 2.35% 증가가 포함되어 있어 약간의 상승 추세를 암시합니다.
Conversely, a notable transaction of approximately $10 million in DOGE transferred from an open wallet to Robinhood reflects bearish sentiment. However, large transactions have also fueled confidence in Dogecoins' long-term potential.
반대로 공개 지갑에서 Robinhood로 이체된 약 1,000만 달러의 주목할만한 DOGE 거래는 약세 정서를 반영합니다. 그러나 대규모 거래는 Dogecoins의 장기적인 잠재력에 대한 자신감을 불러일으켰습니다.
Technical Indicators
기술 지표
Technical indicators present a mixed picture for Dogecoin. Prices hover near the middle limit of the Bollinger Bands, indicating volatile conditions and potential for a downward trend.
기술적 지표는 Dogecoin에 대해 엇갈린 그림을 제시합니다. 가격은 볼린저 밴드의 중간 한계 근처에 머물고 있으며 이는 변동성이 큰 상황과 하락 추세 가능성을 나타냅니다.
The Moving Average Convergence Divergence (MACD) suggests a potential bearish shift, with the MACD line falling below the signal line and diminishing histogram bars. Meanwhile, the Relative Strength Index (RSI) approaches the critical 30 threshold, often regarded as an indication of oversold conditions.
MACD(Moving Average Convergence Divergence)는 MACD 선이 신호 선 아래로 떨어지고 히스토그램 막대가 감소하는 등 잠재적인 약세 이동을 나타냅니다. 한편, 상대강도지수(RSI)는 종종 과매도 상태를 나타내는 것으로 간주되는 임계점인 30에 접근합니다.
Speculation and Future Potential
투기와 미래 가능성
Recent speculation about Dogecoin's adoption for P2P payments on Twitter has also fueled investor interest and market activity. Some analysts predict that DOGE may surpass $0.15 due to a resurgence in positive sentiment.
트위터에서 P2P 결제를 위해 Dogecoin을 채택했다는 최근 추측도 투자자의 관심과 시장 활동을 촉진했습니다. 일부 분석가들은 DOGE가 긍정적인 정서의 부활로 인해 0.15달러를 넘어설 수 있다고 예측합니다.
If successful, DOGE could target the $0.20 resistance level and potentially reach $0.30. On the downside, a drop below $0.12 could lead to support at $0.11 and further declines to around $0.10.
성공하면 DOGE는 $0.20 저항 수준을 목표로 하고 잠재적으로 $0.30에 도달할 수 있습니다. 단점이라면 $0.12 아래로 하락하면 $0.11의 지지를 받고 약 $0.10까지 추가 하락할 수 있습니다.


 Optimisus
 Crypto Intelligence
 BlockchainReporter
 Cryptopolitan_News
 DogeHome
 Crypto Intelligence
 Bitcoin Sistemi EN
 CoinsProbe
 CryptoPotato_News


