Dogecoin Price Surge
도지코인 가격 급등
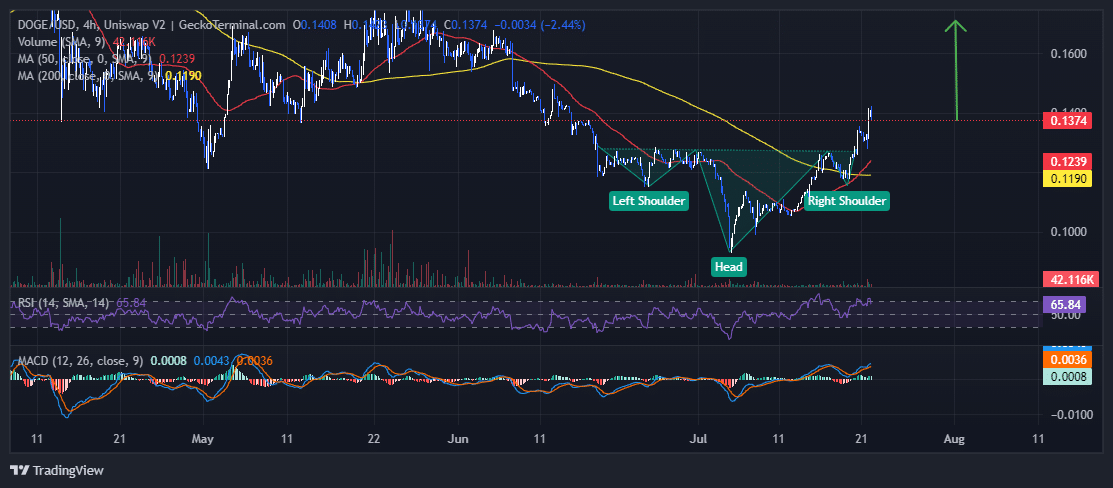
Over the past 24 hours, the Dogecoin price has experienced a 6% increase, elevating it to $0.1374 as of 03:31 a.m. EST. This surge has been accompanied by a 38% increase in trading volume, reaching a staggering $1.4 billion.
지난 24시간 동안 Dogecoin 가격은 6% 상승하여 오전 3시 31분(EST) 현재 $0.1374로 상승했습니다. 이러한 급증은 거래량이 38% 증가하여 무려 14억 달러에 이르렀습니다.
Market Sentiment Buoyancy
시장 심리 부력
The positive market sentiment has contributed to this surge, with the Crypto Fear and Greed Index climbing to 70 from 25 on July 13. The meme coin sector has also rebounded, witnessing a 2% increase in the last 24 hours, resulting in a market capitalization of $53 billion.
암호화폐 공포탐욕 지수가 7월 13일 25에서 70으로 상승하는 등 긍정적인 시장 정서가 이러한 급등에 기여했습니다. 밈 코인 부문도 반등하여 지난 24시간 동안 2% 증가하여 시가총액을 기록했습니다. 530억 달러.
Technical Analysis
기술적 분석

Dogecoin Price Chart Analysis Source: GeckoTerminal.com
Dogecoin 가격 차트 분석 출처: GeckoTerminal.com
A review of historical data from GeckoTerminal reveals that Dogecoin's price reached a low point in June but later consolidated between $0.12 from mid-June to early July. However, the bears gained control, leading to a price drop and the formation of an inverse head and shoulders pattern.
GeckoTerminal의 과거 데이터를 검토한 결과 Dogecoin의 가격은 6월에 최저점에 도달했지만 나중에 6월 중순부터 7월 초까지 0.12달러 사이에 통합된 것으로 나타났습니다. 그러나 하락세가 통제권을 갖게 되면서 가격이 하락하고 역헤드앤숄더 패턴이 형성되었습니다.
The DOGE price surge is attributed to bulls capitalizing on this pattern, propelling the price above the $0.1275 neckline. The token's movement well above both the 50-day and 200-day Simple Moving Averages (SMAs) indicates a sustained bullish trend. The 50-day SMA has exceeded the 200-day SMA, forming a golden cross at $0.1194, further supporting the bullish sentiment.
DOGE 가격 급등은 이러한 패턴을 활용하여 가격이 $0.1275 네크라인 위로 상승한 상승세에 기인합니다. 50일 및 200일 단순 이동 평균(SMA)을 훨씬 넘는 토큰의 움직임은 지속적인 강세 추세를 나타냅니다. 50일 SMA가 200일 SMA를 넘어 $0.1194에 골든 크로스를 형성하여 강세 심리를 더욱 뒷받침했습니다.
The Relative Strength Index (RSI) suggests that sellers have an advantage, as it exceeds the 50-midline level and approaches the 70-overbought region, currently at 65.
상대강도지수(RSI)는 50 중간선을 넘어 현재 65인 70 과매수 영역에 접근하기 때문에 판매자가 유리하다는 점을 시사합니다.
The Moving Average Convergence Divergence (MACD) also highlights Dogecoin's bullish trend, as it trades comfortably above the neutral line. The positive momentum is evident in the green bars on the histogram, which are also positioned above the zero line.
MACD(Moving Average Convergence Divergence)는 또한 중립선 위에서 편안하게 거래되기 때문에 Dogecoin의 강세 추세를 강조합니다. 히스토그램의 녹색 막대에서 긍정적인 모멘텀이 뚜렷이 나타나며, 이 막대 역시 0선 위에 위치합니다.
Dogecoin Price Prediction
Dogecoin 가격 예측
The 4-hour chart analysis shows a strong bullish outlook for Dogecoin, with bulls leveraging the inverse head and shoulders pattern to target $0.17.
4시간 차트 분석은 Dogecoin에 대한 강력한 강세 전망을 보여줍니다. 강세는 역 헤드 앤 숄더 패턴을 활용하여 0.17달러를 목표로 삼고 있습니다.
However, the RSI's indication of overvaluation may lead to a price correction, potentially resulting in a retracement to $0.12.
그러나 RSI의 과대평가 징후는 가격 조정으로 이어질 수 있으며 잠재적으로 $0.12로 되돌릴 수 있습니다.
Investment Opportunities
투자 기회
As Dogecoin strives for a bullish trend continuation, investors have expressed interest in Shiba Shootout (SHIBASHOOT), a Shiba Inu derivative that has raised over $730k in its presale.
Dogecoin이 강세 추세 지속을 위해 노력함에 따라 투자자들은 사전 판매에서 730,000달러 이상을 모금한 Shiba Inu 파생 상품인 Shiba Shootout(SHIBASHOOT)에 관심을 표명했습니다.


 DogeHome
 Optimisus
 Crypto News Land
 Optimisus
 Cryptopolitan_News
 Cryptopolitan


