Dogecoin Price Surge
ドージコイン価格の高騰
Over the past 24 hours, the Dogecoin price has experienced a 6% increase, elevating it to $0.1374 as of 03:31 a.m. EST. This surge has been accompanied by a 38% increase in trading volume, reaching a staggering $1.4 billion.
過去 24 時間で、ドージコインの価格は 6% 上昇し、東部標準時間午前 3 時 31 分の時点で 0.1374 ドルまで上昇しました。この急増に伴い取引高も38%増加し、14億ドルという驚異的な額に達しました。
Market Sentiment Buoyancy
市場心理の活況
The positive market sentiment has contributed to this surge, with the Crypto Fear and Greed Index climbing to 70 from 25 on July 13. The meme coin sector has also rebounded, witnessing a 2% increase in the last 24 hours, resulting in a market capitalization of $53 billion.
市場のポジティブなセンチメントがこの急騰に寄与し、仮想通貨恐怖と貪欲指数は7月13日の25から70に上昇した。ミームコインセクターも回復し、過去24時間で2%上昇し、その結果時価総額が上昇した。 530億ドル。
Technical Analysis
テクニカル分析

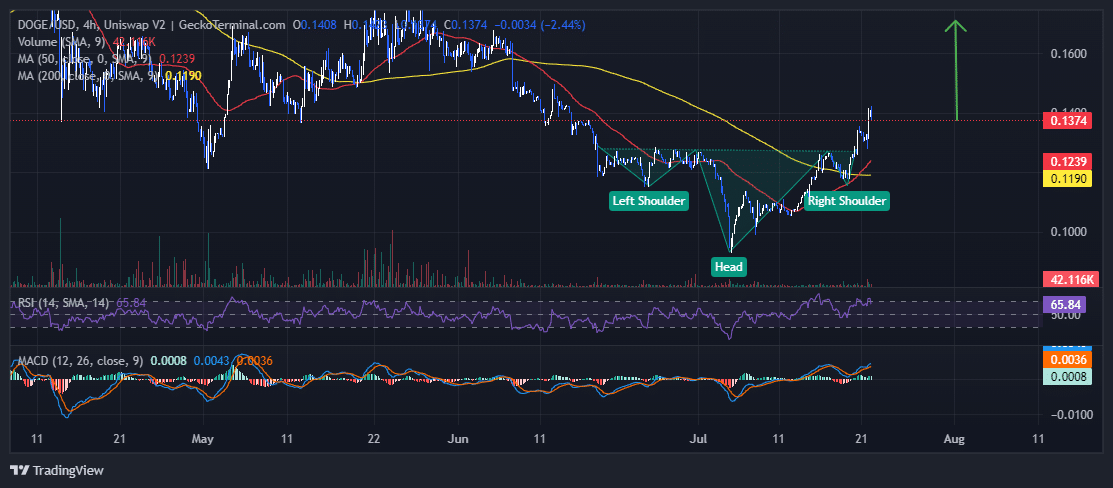
Dogecoin Price Chart Analysis Source: GeckoTerminal.com
Dogecoin 価格チャート分析 出典: Geckoterminal.com
A review of historical data from GeckoTerminal reveals that Dogecoin's price reached a low point in June but later consolidated between $0.12 from mid-June to early July. However, the bears gained control, leading to a price drop and the formation of an inverse head and shoulders pattern.
Geckoterminal の過去のデータを確認すると、Dogecoin の価格は 6 月に最低点に達したが、その後 6 月中旬から 7 月上旬にかけて 0.12 ドルの間で安定したことが明らかになりました。しかし、弱気派が主導権を握り、価格下落と逆ヘッドアンドショルダーパターンの形成につながった。
The DOGE price surge is attributed to bulls capitalizing on this pattern, propelling the price above the $0.1275 neckline. The token's movement well above both the 50-day and 200-day Simple Moving Averages (SMAs) indicates a sustained bullish trend. The 50-day SMA has exceeded the 200-day SMA, forming a golden cross at $0.1194, further supporting the bullish sentiment.
DOGE価格の急騰は、強気派がこのパターンを利用し、価格を0.1275ドルのネックラインを超えて押し上げたことによるものと考えられる。 50日および200日の単純移動平均(SMA)の両方を大きく上回るトークンの動きは、持続的な強気傾向を示しています。 50日SMAは200日SMAを上回り、0.1194ドルでゴールデンクロスを形成し、強気地合いをさらに裏付けている。
The Relative Strength Index (RSI) suggests that sellers have an advantage, as it exceeds the 50-midline level and approaches the 70-overbought region, currently at 65.
相対力指数(RSI)は、中間線レベルの50を超え、買われ過ぎの70領域(現在65)に近づいていることから、売り手が有利であることを示唆している。
The Moving Average Convergence Divergence (MACD) also highlights Dogecoin's bullish trend, as it trades comfortably above the neutral line. The positive momentum is evident in the green bars on the histogram, which are also positioned above the zero line.
移動平均収束ダイバージェンス(MACD)も、ニュートラルラインを快適に上回って取引されているドージコインの強気傾向を強調しています。ヒストグラムの緑色のバーはプラスの勢いを示しており、これもゼロラインの上に位置しています。
Dogecoin Price Prediction
ドージコイン価格予測
The 4-hour chart analysis shows a strong bullish outlook for Dogecoin, with bulls leveraging the inverse head and shoulders pattern to target $0.17.
4時間チャート分析はドージコインの強い強気見通しを示しており、強気派は逆ヘッドアンドショルダーパターンを利用して0.17ドルを目標にしている。
However, the RSI's indication of overvaluation may lead to a price correction, potentially resulting in a retracement to $0.12.
ただし、RSIの過大評価の兆候は価格修正につながる可能性があり、その結果、0.12ドルまでリトレースメントされる可能性があります。
Investment Opportunities
投資機会
As Dogecoin strives for a bullish trend continuation, investors have expressed interest in Shiba Shootout (SHIBASHOOT), a Shiba Inu derivative that has raised over $730k in its presale.
ドージコインが強気トレンドの継続を目指す中、投資家はプレセールで73万ドル以上を集めた柴犬の派生商品、シバシュートアウト(SHIBASHOOT)に興味を示している。


 DogeHome
 Optimisus
 Crypto News Land
 Optimisus
 Cryptopolitan_News
 Cryptopolitan


