Dogecoin Price Fluctuation and Technical Analysis
Dogecoin 가격 변동 및 기술적 분석
In the past two weeks, the Dogecoin price has declined by 20% and by 2% in the last 24 hours. As of 02:21 a.m. EST, DOGE is trading at $0.3190, with a trading volume surge of 43% to $2.2 billion.
지난 2주 동안 Dogecoin 가격은 20%, 지난 24시간 동안 2% 하락했습니다. 오전 2시 21분(EST) 현재 DOGE는 0.3190달러에 거래되고 있으며, 거래량은 43% 급증한 22억 달러입니다.
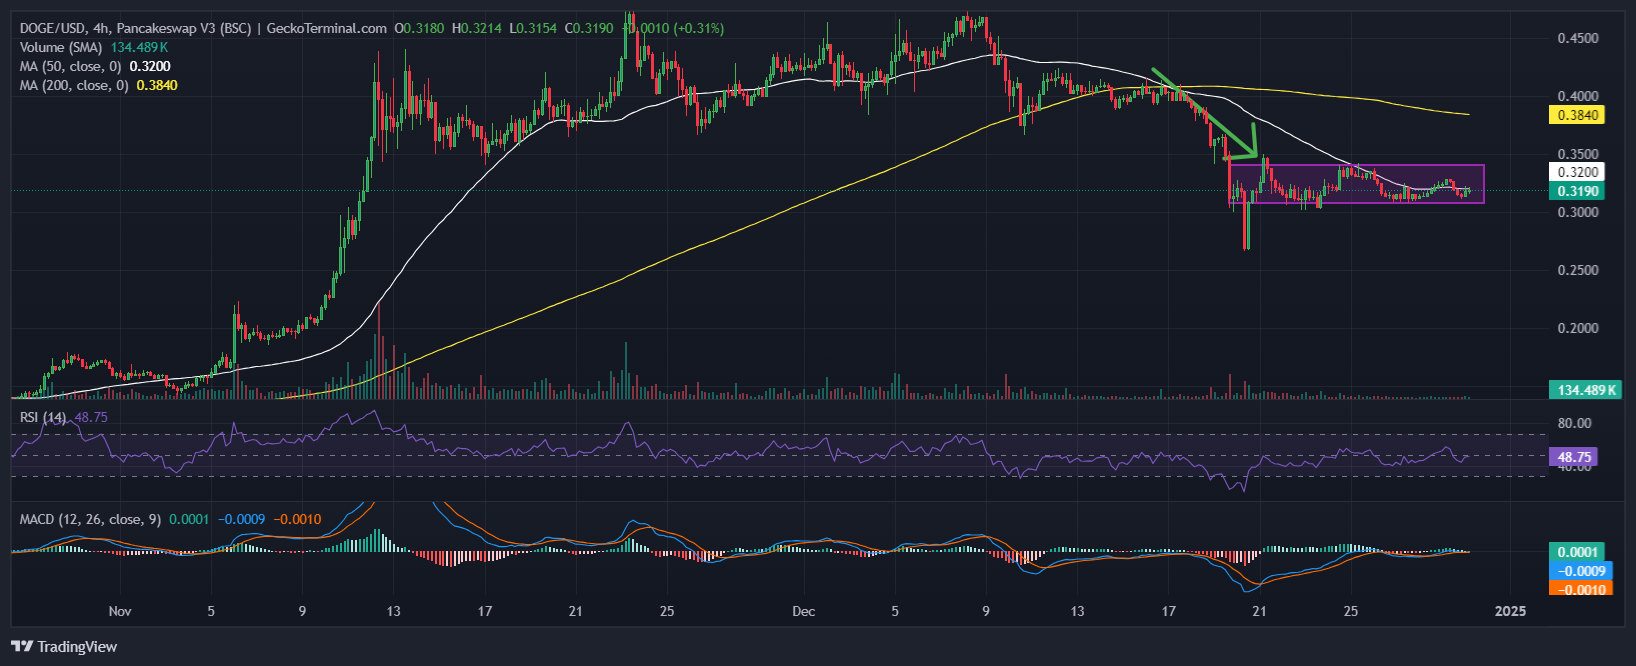
The Dogecoin price has been consolidating within a defined range in recent weeks following a significant drop in mid-December. DOGE is currently priced at $0.319, demonstrating consolidation after failing to overcome key resistance levels.
Dogecoin 가격은 12월 중순에 크게 하락한 후 최근 몇 주 동안 정의된 범위 내에서 통합되었습니다. DOGE의 가격은 현재 0.319달러로 주요 저항 수준을 극복하지 못한 후 통합을 보여줍니다.
After the sharp downtrend from a recent high near $0.40, the price has formed a sideways movement within a clear rectangle pattern, indicating indecision among traders.
$0.40에 가까운 최근 고점에서 급격한 하락 추세를 보인 후 가격은 명확한 직사각형 패턴 내에서 횡보 움직임을 형성하여 거래자들의 우유부단함을 나타냅니다.
Support remains at approximately $0.30, while resistance ranges from $0.33 to $0.34, according to data from GeckoTerminal.
GeckoTerminal의 데이터에 따르면 지지선은 약 $0.30으로 유지되고 저항 범위는 $0.33~$0.34입니다.
Recently, the DOGE price retested the 50-day Simple Moving Average (SMA), which has served as dynamic resistance. The 200-day SMA, at $0.384, remains significantly higher than the current price, suggesting a bearish bias in the medium term.
최근 DOGE 가격은 동적 저항 역할을 했던 50일 단순 이동 평균(SMA)을 다시 테스트했습니다. 200일 SMA는 0.384달러로 현재 가격보다 훨씬 높은 수준을 유지하고 있어 중기적으로 약세 편향을 시사합니다.
The Relative Strength Index (RSI) is at 48.75, indicating a neutral trend with a slight bearish bias. This suggests that neither buyers nor sellers hold a significant advantage in the market.
상대강도지수(RSI)는 48.75로 약간의 약세 편향이 있는 중립 추세를 나타냅니다. 이는 구매자와 판매자 모두 시장에서 상당한 이점을 갖고 있지 않음을 의미합니다.
The absence of movement above the 50 level confirms the ongoing consolidation period, with no immediate signs of overbought or oversold conditions.
50 수준 이상으로의 움직임이 없으면 과매수 또는 과매도 상태의 즉각적인 징후가 없이 지속적인 횡보 기간을 확인합니다.
Meanwhile, the Moving Average Convergence Divergence (MACD) has crossed above the signal line, indicating a potential shift towards bullish momentum.
한편, MACD(Moving Average Convergence Divergence)가 신호선 위로 교차하여 강세 모멘텀으로 전환할 가능성이 있음을 나타냅니다.

DOGE Price Forecast
DOGE 가격 예측
Based on technical analysis, Dogecoin's immediate price action is expected to continue within the range of $0.30 (support) and $0.33-$0.34 (resistance).
기술적 분석에 따르면 Dogecoin의 즉각적인 가격 조치는 $0.30(지원) 및 $0.33-$0.34(저항) 범위 내에서 계속될 것으로 예상됩니다.
A breakout above the 50-day SMA could push DOGE to test higher resistance levels around $0.36-$0.38, aligning with the 200-day SMA.
50일 SMA를 돌파하면 DOGE가 200일 SMA에 맞춰 $0.36-$0.38 정도의 더 높은 저항 수준을 테스트하게 될 수 있습니다.
If the Dogecoin price breaks above $0.34 with significant volume, it may rally toward $0.40, regaining bullish momentum.
Dogecoin 가격이 상당한 거래량으로 0.34달러를 넘어설 경우 0.40달러를 향해 반등하여 강세 모멘텀을 다시 얻을 수 있습니다.
Conversely, a breakdown below $0.30 could result in a decline to $0.25 or lower, confirming further downward pressure.
반대로, $0.30 미만으로 하락하면 $0.25 이하로 하락하여 추가 하락 압력이 확인될 수 있습니다.


 BlockchainReporter
 Cryptopolitan_News
 DeFi Planet
 TheCoinrise Media
 DogeHome
 CoinoMedia
 COINTURK NEWS
 Cryptopolitan_News
 Optimisus


