Dogecoin Price Fluctuation and Technical Analysis
ドージコインの価格変動とテクニカル分析
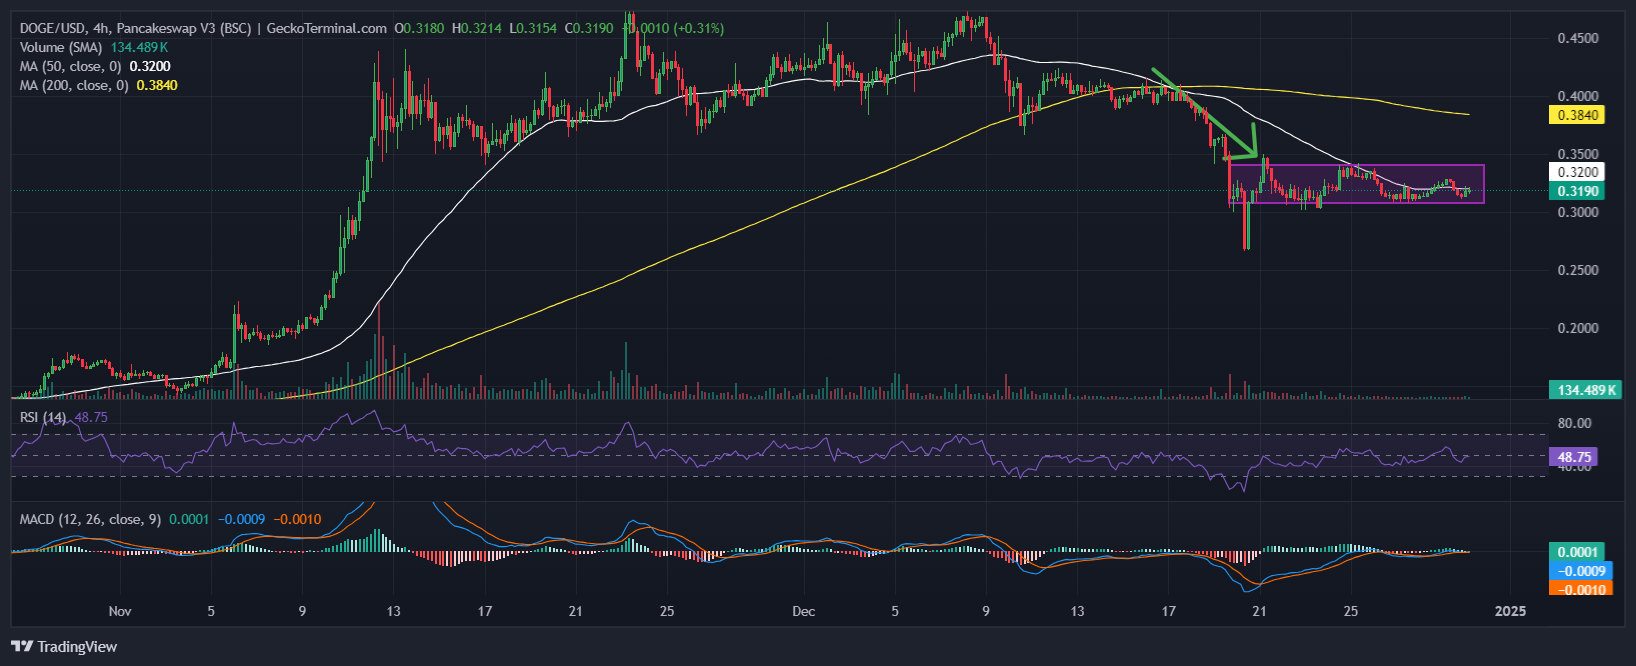
In the past two weeks, the Dogecoin price has declined by 20% and by 2% in the last 24 hours. As of 02:21 a.m. EST, DOGE is trading at $0.3190, with a trading volume surge of 43% to $2.2 billion.
過去 2 週間でドージコインの価格は 20% 下落し、過去 24 時間では 2% 下落しました。東部標準時午前2時21分の時点で、DOGEは0.3190ドルで取引されており、出来高は43%増の22億ドルに急増した。
The Dogecoin price has been consolidating within a defined range in recent weeks following a significant drop in mid-December. DOGE is currently priced at $0.319, demonstrating consolidation after failing to overcome key resistance levels.
ドージコインの価格は、12月中旬の大幅な下落に続き、ここ数週間で定められた範囲内で落ち着きを見せています。 DOGEの価格は現在0.319ドルで、主要な抵抗レベルを克服できなかった後の値固めを示しています。
After the sharp downtrend from a recent high near $0.40, the price has formed a sideways movement within a clear rectangle pattern, indicating indecision among traders.
0.40ドル付近の最近の高値からの急激な下降傾向の後、価格は明確な長方形のパターン内で横方向の動きを形成しており、トレーダー間の優柔不断さを示しています。
Support remains at approximately $0.30, while resistance ranges from $0.33 to $0.34, according to data from GeckoTerminal.
Geckoterminal のデータによると、サポートは約 0.30 ドルにとどまり、レジスタンスは 0.33 ドルから 0.34 ドルの範囲にあります。
Recently, the DOGE price retested the 50-day Simple Moving Average (SMA), which has served as dynamic resistance. The 200-day SMA, at $0.384, remains significantly higher than the current price, suggesting a bearish bias in the medium term.
最近、DOGE価格は動的抵抗として機能してきた50日単純移動平均(SMA)を再テストしました。 200 日 SMA は 0.384 ドルであり、依然として現在の価格より大幅に高く、中期的には弱気バイアスであることを示唆しています。
The Relative Strength Index (RSI) is at 48.75, indicating a neutral trend with a slight bearish bias. This suggests that neither buyers nor sellers hold a significant advantage in the market.
相対力指数 (RSI) は 48.75 で、わずかに弱気の傾向がある中立的な傾向を示しています。これは、買い手も売り手も市場で大きな優位性を持っていないことを示唆しています。
The absence of movement above the 50 level confirms the ongoing consolidation period, with no immediate signs of overbought or oversold conditions.
50レベルを超える動きがないことは、買われ過ぎまたは売られ過ぎの状況を示す即時の兆候はなく、保ち合い期間が続いていることを裏付けています。
Meanwhile, the Moving Average Convergence Divergence (MACD) has crossed above the signal line, indicating a potential shift towards bullish momentum.
一方、移動平均収束ダイバージェンス(MACD)はシグナルラインを上回っており、強気の勢いに向かう可能性を示しています。

DOGE Price Forecast
DOGE価格予測
Based on technical analysis, Dogecoin's immediate price action is expected to continue within the range of $0.30 (support) and $0.33-$0.34 (resistance).
テクニカル分析に基づいて、ドージコインの当面の価格動向は、0.30ドル(サポート)と0.33〜0.34ドル(レジスタンス)の範囲内で続くと予想されます。
A breakout above the 50-day SMA could push DOGE to test higher resistance levels around $0.36-$0.38, aligning with the 200-day SMA.
50日SMAを上抜ければ、DOGEは200日SMAに合わせて0.36~0.38ドル付近のより高い抵抗線を試すようになる可能性がある。
If the Dogecoin price breaks above $0.34 with significant volume, it may rally toward $0.40, regaining bullish momentum.
ドージコインの価格がかなりの出来高で0.34ドルを超えた場合、0.40ドルに向けて上昇し、強気の勢いを取り戻す可能性があります。
Conversely, a breakdown below $0.30 could result in a decline to $0.25 or lower, confirming further downward pressure.
逆に、0.30ドルを下回る場合は0.25ドル以下まで下落する可能性があり、さらなる下押し圧力が確認される。


 Optimisus
 Cryptopolitan_News
 BH NEWS
 COINTURK NEWS
 DogeHome
 CoinoMedia
 Crypto News Land
 CoinsProbe


