Dogecoin Price Prediction: Bucking the trend of a broader market retracement, the DOGE price has exhibited a remarkable recovery, consistently climbing over the last three days. This surge, amounting to a 20% increase to reach a $0.087 peak, appears to be spurred by the exhilarating news of a physical Dogecoin mission to the Earth’s moon. could this momentum fuel this memecoin’s ascent past the $0.01 threshold?
Dogecoin 가격 예측: 더 넓은 시장 되돌림 추세를 거스르며 DOGE 가격은 지난 3일 동안 지속적으로 상승하는 놀라운 회복세를 보였습니다. 20% 증가하여 최고 $0.087에 도달한 이러한 급등은 지구의 달에 대한 실제 Dogecoin 임무에 대한 신나는 소식에 의해 촉발된 것으로 보입니다. 이 모멘텀이 이 밈코인의 상승을 촉진하여 $0.01 임계값을 넘어설 수 있을까요?
Also Read: Why Dogecoin & HBAR Are Rising Amid Crypto Market Downturn?
Bullish Pattern Hints Rally to $0.11
강세 패턴 힌트 $0.11까지 상승
- Dogecoin price rising for 5 consecutive weeks with a substantial increase in volume indicates sustained momentum,
- The 20-day EMA slope is offering dynamic support to rising prices
- The 24-hour trading volume in Dogecoin is $1.9 Million, indicating an 87% gain.
20일 EMA 기울기는 가격 상승에 대한 역동적인 지원을 제공합니다.
 Source-Tradingview
소스-Tradingview
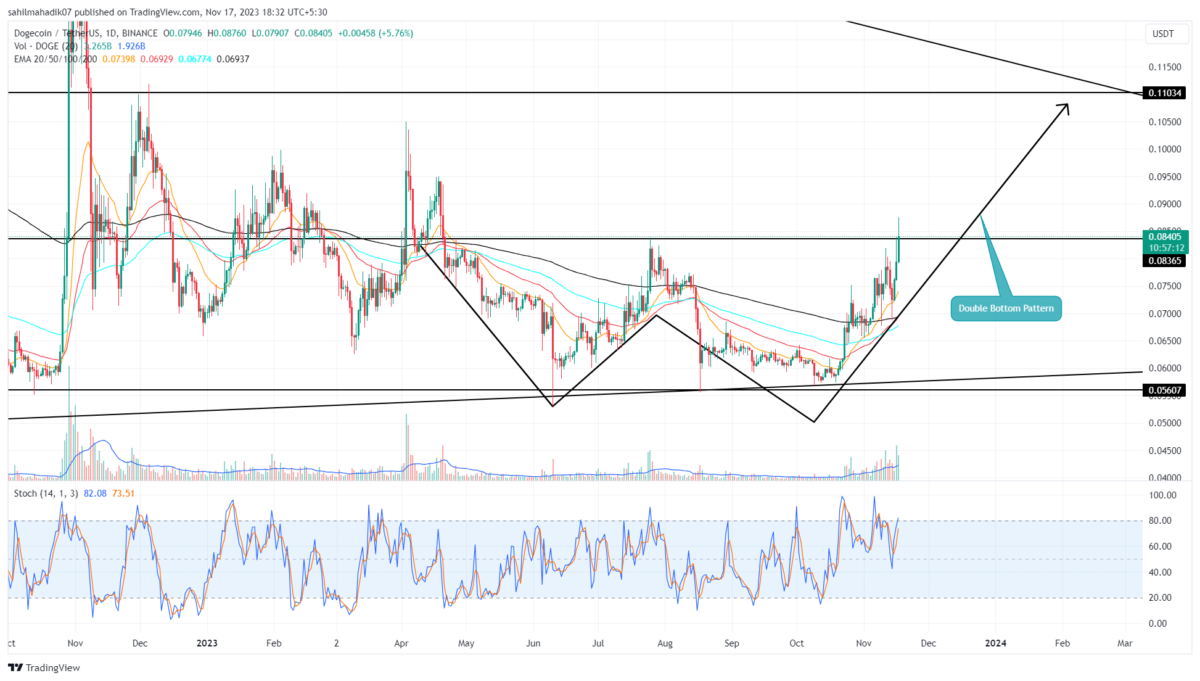
Over the past 30 days, the Dogecoin price has traveled a sustained recovery, rising from the $0.057 level to a current trading price of $0.082, registering a gain of 45%. Amid this rally, the coin price witnessed two pullbacks indicating the buyers are managing to absorb the overhead selling pressure and make a strong strikeback.
The Daily time frame Chart reveals that this rally is contributing to the formation of a bullish ‘Double Bottom‘ reversal pattern. Just today, the DOGE price surged by 10%, approaching the pattern’s neckline, potentially catalyzing this bullish formation.
일일 시간대 차트에서는 이번 랠리가 강세 '이중 바닥' 반전 패턴 형성에 기여하고 있음을 보여줍니다. 바로 오늘 DOGE 가격이 10% 급등하여 패턴의 네크라인에 접근했고 잠재적으로 이러한 강세 형성을 촉진했습니다.
A daily close above $0.083 could convert this resistance level into a support platform, potentially paving the way for a 32% surge to the dual resistance at $0.11, marked by a downtrend line. This dynamic resistance has been a critical factor in the correction phase; thus, breaching it could signal a significant trend reversal.
Healthy Retracement Sets Higher Recovery
While an upward trajectory for the DOGE price seems probable, intermittent pullbacks might occur, serving to consolidate the bullish momentum. Historical data suggests these corrections align well with the 50% Fibonacci retracement level, an indicator of a robust pullback. Consequently, investors might consider the 50% or 38.2% Fibonacci levels as strategic points for setting stop-loss orders or reassessing their positions
DOGE 가격의 상승 궤적이 가능성이 있는 것처럼 보이지만 간헐적인 하락이 발생하여 강세 모멘텀을 강화할 수 있습니다. 과거 데이터에 따르면 이러한 조정은 강력한 하락세를 나타내는 지표인 50% 피보나치 되돌림 수준과 잘 일치합니다. 결과적으로, 투자자들은 50% 또는 38.2% 피보나치 수준을 손절매 주문 설정 또는 포지션 재평가를 위한 전략적 지점으로 고려할 수 있습니다.
- Stochastic Oscillator: Rising slopes in the %K and %D lines signal active bullish momentum, reinforcing the positive trend.
- Exponential Moving Average: A ‘golden crossover’ between the 50-day and 200-day EMAs could strengthen buyer confidence, fueling the ongoing recovery.
지수 이동 평균: 50일 EMA와 200일 EMA 사이의 '골든 크로스오버'는 구매자의 신뢰를 강화하여 지속적인 회복을 촉진할 수 있습니다.
The post Dogecoin Price Prediction: Why $DOGE Recovery is Set to Extend 32% appeared first on CoinGape.
Dogecoin 가격 예측: $DOGE 복구가 32% 연장으로 설정된 이유 게시물이 CoinGape에 처음 등장했습니다.


 crypto.ro English
 DogeHome
 Crypto News Land
 ETHNews
 CFN
CFN U_Today
 Thecoinrepublic.com
 Optimisus


