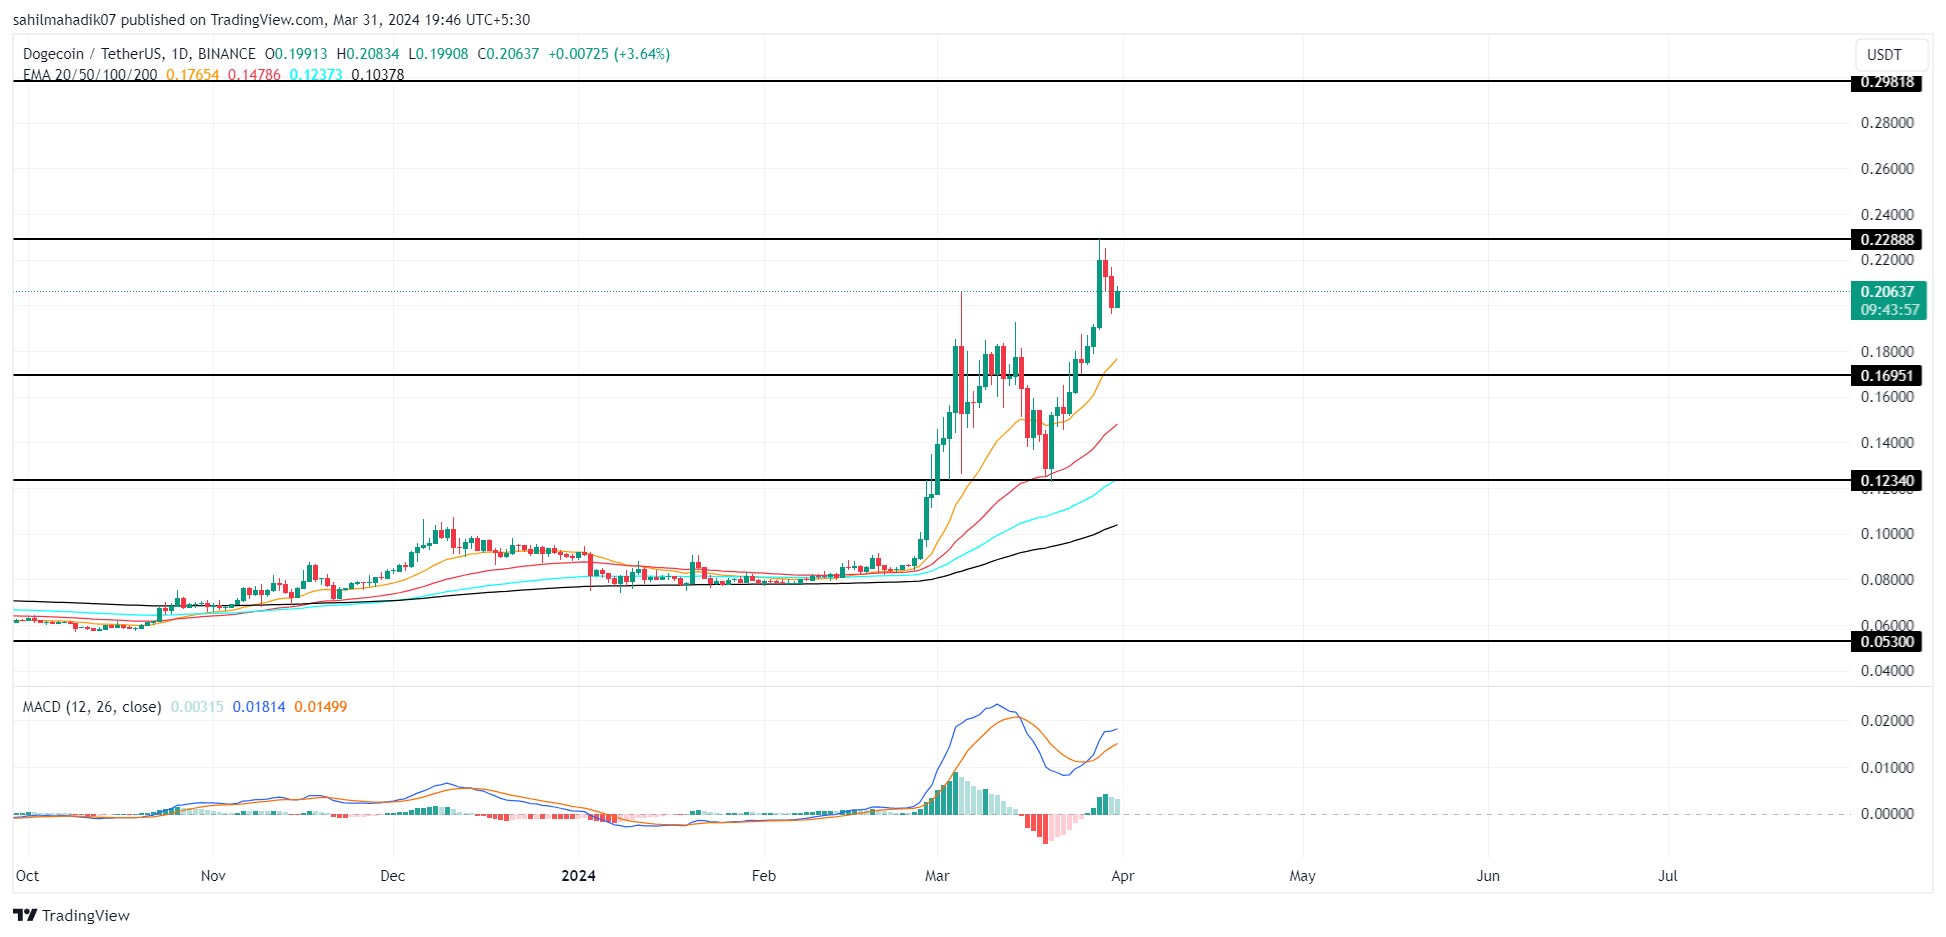
Dogecoin Price Prediction: The cryptocurrency market is likely witnessing a pre-halving consolidation, evidenced by a narrow range formation in Bitcoin. While a majority of major altcoins follow the same trend, the leading meme cryptocurrency, Dogecoin, showcased a notable upswing hitting a 27-month high of $0.228.
Dogecoin 가격 예측: 암호화폐 시장은 비트코인의 좁은 범위 형성으로 입증되는 반감기 전 통합을 목격할 가능성이 높습니다. 대부분의 주요 알트코인이 동일한 추세를 따르는 반면, 선도적인 밈 암호화폐인 Dogecoin은 27개월 최고치인 $0.228를 기록하는 주목할만한 상승세를 보여주었습니다.
However, the market is poised for a potential uptrend in the upcoming weeks as we approach April- the scheduled month for Bitcoin halving. Will this renewed market recovery push the DOGE price to the $0.3 milestone?
그러나 비트코인 반감기가 예정된 달인 4월이 다가오면서 시장은 향후 몇 주 동안 잠재적인 상승 추세를 보일 준비가 되어 있습니다. 이러한 새로운 시장 회복으로 DOGE 가격이 0.3달러 수준으로 높아질까요?
Also Read: Dogecoin Price Gains Momentum as Whales Dive In, Is $0.3 Next Stop?
또한 읽어보세요: 고래가 뛰어들면서 Dogecoin 가격이 모멘텀을 얻습니다. $0.3가 다음 정지인가요?
Rounding Bottom Pattern Sets DOGE For Prolong Rally

The Dogecoin price rebounded from its last correction in March’s fourth week as buyers suitable support at the 50-day EMA. The positive turnaround uplifted the asset from $0.122 to $0.21 high, registering 86% growth.
구매연속 랠리를 위한 반올림 바닥 패턴 세트 DOGEDogecoin| TradingviewDogecoin 가격은 구매자가 50일 EMA에서 적절한 지원을 받으면서 3월 넷째 주 마지막 조정에서 반등했습니다. 긍정적인 전환으로 자산이 $0.122에서 $0.21로 상승하여 86%의 성장을 기록했습니다.
The rising price has also surpassed the last swing high of $0.192, providing buyers with the next stepping stone to prolong recovery. Amid the current consolidation trend in the market, the DOGE price sees a minor pullback of 8% in 72 hours currently trading at $0.21.
상승하는 가격은 또한 지난 스윙 최고치인 0.192달러를 넘어섰으며, 이는 구매자에게 회복을 연장할 수 있는 다음 디딤돌을 제공합니다. 현재 시장의 통합 추세 속에서 DOGE 가격은 현재 $0.21에 거래되고 있으며 72시간 만에 8% 소폭 하락한 것으로 보입니다.
With a market cap of $30.2 Billion, Dogecoin holds its position as the 8th largest cryptocurrency as per Coinmarketcap.
시가총액이 302억 달러에 달하는 Dogecoin은 Coinmarketcap 기준으로 8번째로 큰 암호화폐로서의 지위를 유지하고 있습니다.
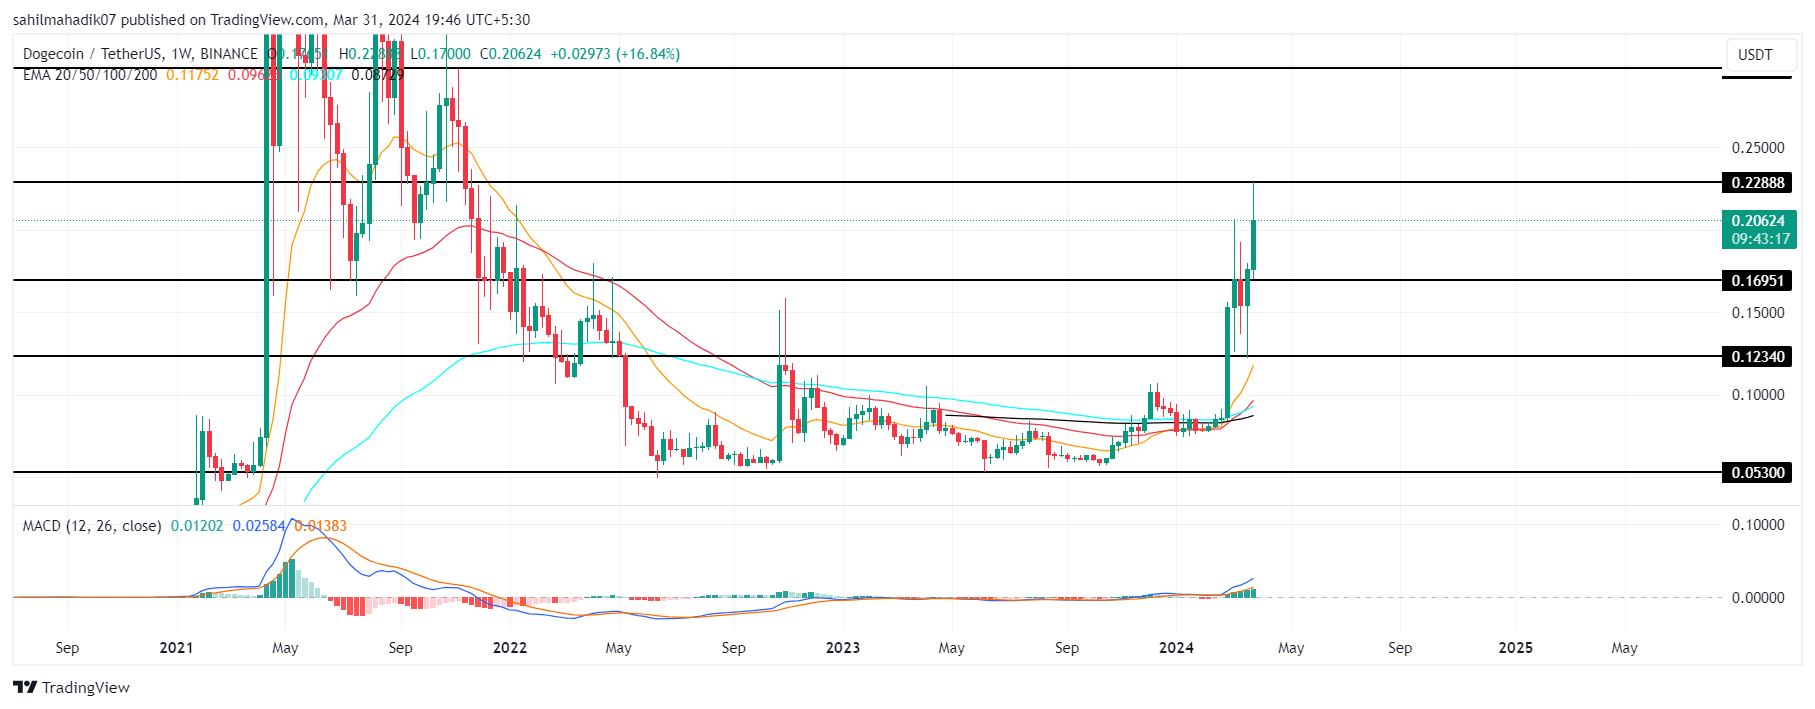
However, an analysis of the higher time frame chart shows parabolic growth resembling the formation of a rounding bottom pattern. The chart pattern is often considered a sign of a downtrend bottoming and an opportunity for a new bull run to emerge.
그러나 더 높은 시간대 차트를 분석하면 둥근 바닥 패턴의 형성과 유사한 포물선 성장이 나타납니다. 차트 패턴은 종종 하락 추세 바닥의 신호이자 새로운 강세장이 나타날 기회로 간주됩니다.

Should the crypto market exhibit a bullish response to the anticipated halving, in line with historical trends and investor expectations, Dogecoin’s price is likely to align with the bullish pattern formation.
도지코인 가격| Tradingview암호화폐 시장이 역사적 추세와 투자자 기대에 맞춰 예상되는 반감기에 대해 낙관적인 반응을 보인다면 Dogecoin의 가격은 강세 패턴 형성과 일치할 가능성이 높습니다.
With sustained buying, the current rally may chase a potential target of $0.3, followed by $0.35 and $0.448.
지속적인 매수를 통해 현재 랠리는 $0.3의 잠재적 목표를 추적할 수 있으며 그 다음에는 $0.35 및 $0.448이 뒤따를 수 있습니다.
Also Read: Top Analyst Predicts Bitcoin To Hit $75K, But There’s A Catch
또한 읽어 보세요: 최고 분석가는 비트코인이 75,000달러에 도달할 것으로 예측하지만 여기에는 함정이 있습니다.
Technical Indicator
- Exponential Moving Average: A sharp upswing from the fast-moving 20-day EMA indicates a high momentum rally which usually favors breakout traders.
- Average Directional Index (ADX): The ADX slope at 41% indicates the overextended rally may need some pullbacks to regain strength.
기술 지표지수 이동 평균: 빠르게 움직이는 20일 EMA의 급격한 상승은 일반적으로 브레이크아웃 거래자에게 유리한 높은 모멘텀 랠리를 나타냅니다. 평균 방향 지수(ADX): 41%의 ADX 기울기는 과도하게 확장된 랠리가 약간의 후퇴가 필요할 수 있음을 나타냅니다. 힘을 되찾으세요.


 ETHNews
 Coin Edition
 DogeHome
 Crypto Daily™
 BlockchainReporter
 Crypto Daily™
 Crypto Daily™
 crypto.news
 CoinPedia News


