Dogecoin Price Prediction: The cryptocurrency market is likely witnessing a pre-halving consolidation, evidenced by a narrow range formation in Bitcoin. While a majority of major altcoins follow the same trend, the leading meme cryptocurrency, Dogecoin, showcased a notable upswing hitting a 27-month high of $0.228.
ドージコインの価格予測: 仮想通貨市場は、ビットコインの狭いレンジ形成から明らかなように、半減期前の統合が見られる可能性が高い。主要なアルトコインの大部分が同じ傾向をたどる一方で、主要なミーム暗号通貨であるドージコインは顕著な上昇を見せ、27か月ぶりの高値である0.228ドルを記録した。
However, the market is poised for a potential uptrend in the upcoming weeks as we approach April- the scheduled month for Bitcoin halving. Will this renewed market recovery push the DOGE price to the $0.3 milestone?
しかし、ビットコインの半減期が予定されている4月が近づくにつれ、市場は今後数週間で潜在的な上昇傾向に向かう準備が整っている。この新たな市場回復により、DOGE価格は0.3ドルの節目まで押し上げられるでしょうか?
Also Read: Dogecoin Price Gains Momentum as Whales Dive In, Is $0.3 Next Stop?
こちらもお読みください: クジラの急降下でドージコイン価格が勢いを増し、次のストップは0.3ドル?
Rounding Bottom Pattern Sets DOGE For Prolong Rally

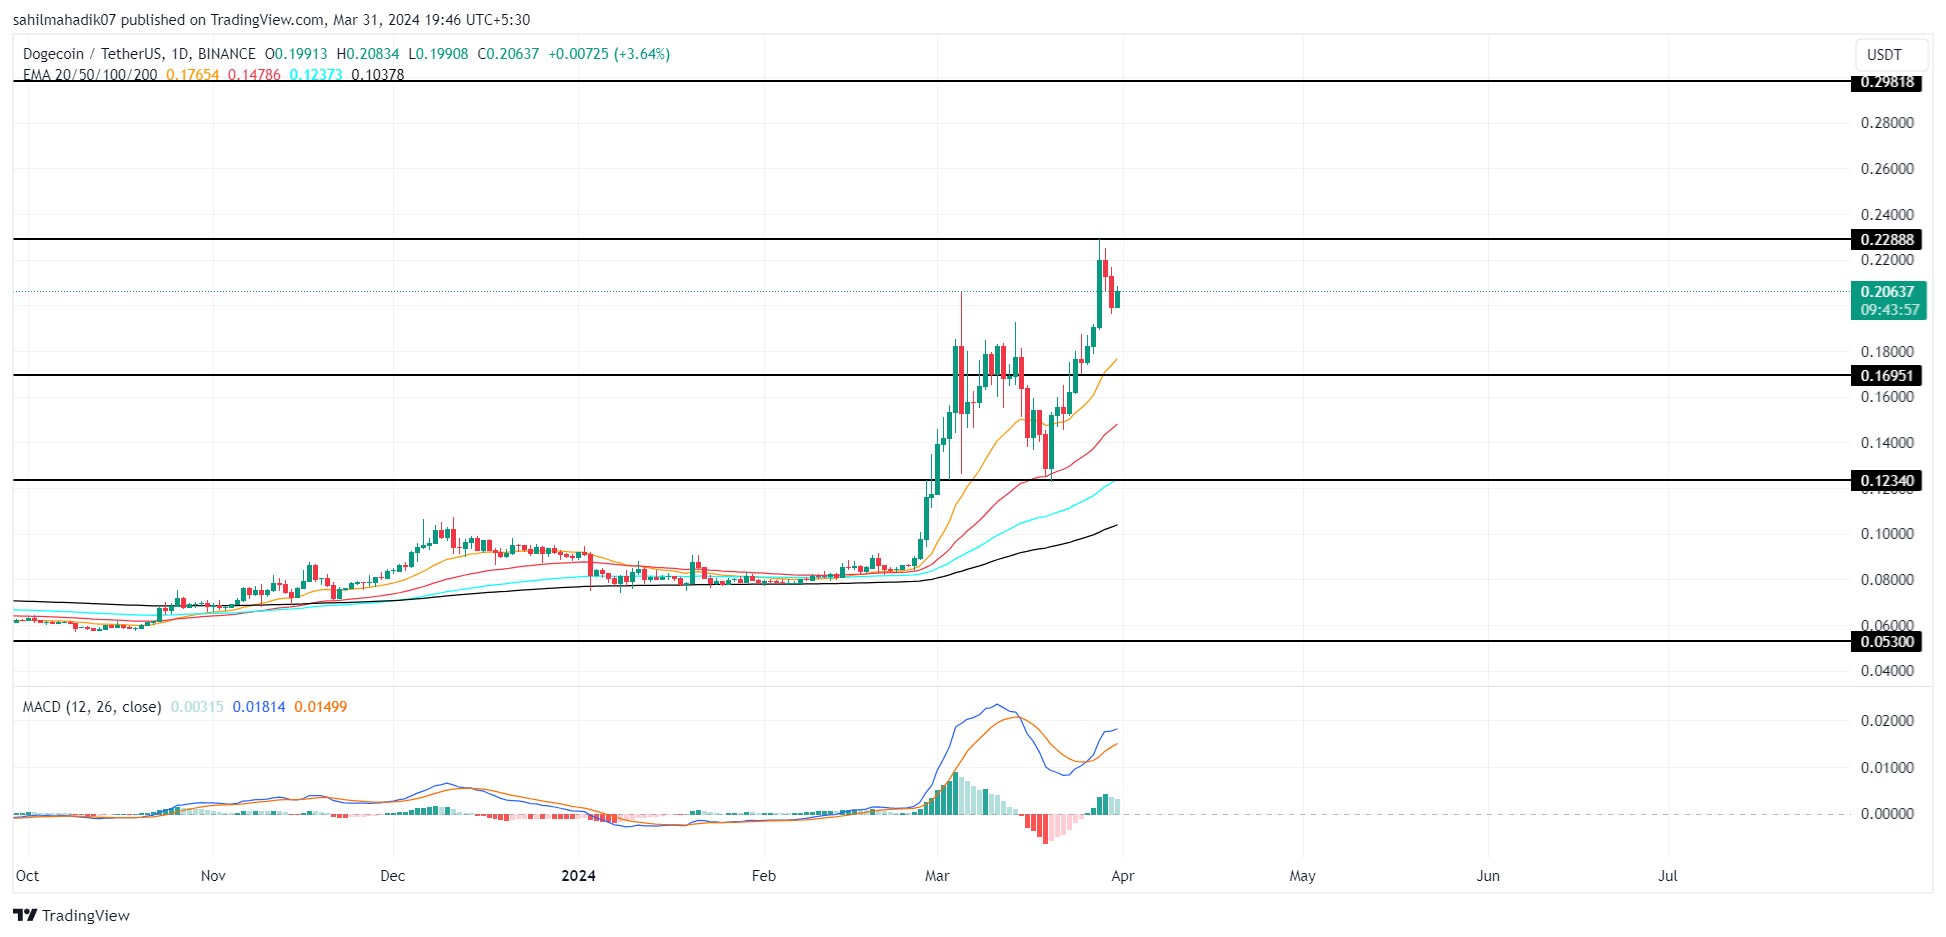
The Dogecoin price rebounded from its last correction in March’s fourth week as buyers suitable support at the 50-day EMA. The positive turnaround uplifted the asset from $0.122 to $0.21 high, registering 86% growth.
底の丸いパターンがDOGEを長期ラリーに設定Dogecoin価格| Tradingviewドージコインの価格は、買い手が50日間EMAで適切なサポートを受けたため、3月第4週の最後の調整から反発しました。好転により資産は0.122ドルから0.21ドルの高値まで上昇し、86%の成長を記録した。
The rising price has also surpassed the last swing high of $0.192, providing buyers with the next stepping stone to prolong recovery. Amid the current consolidation trend in the market, the DOGE price sees a minor pullback of 8% in 72 hours currently trading at $0.21.
価格の上昇は前回のスイング高値である0.192ドルも上回り、買い手には回復を長引かせるための次の足がかりとなった。現在の市場の統合傾向の中で、DOGE価格は72時間で8%の若干の下落が見られ、現在0.21ドルで取引されています。
With a market cap of $30.2 Billion, Dogecoin holds its position as the 8th largest cryptocurrency as per Coinmarketcap.
Coinmarketcap によれば、Dogecoin の時価総額は 302 億ドルで、第 8 位の仮想通貨としての地位を保っています。
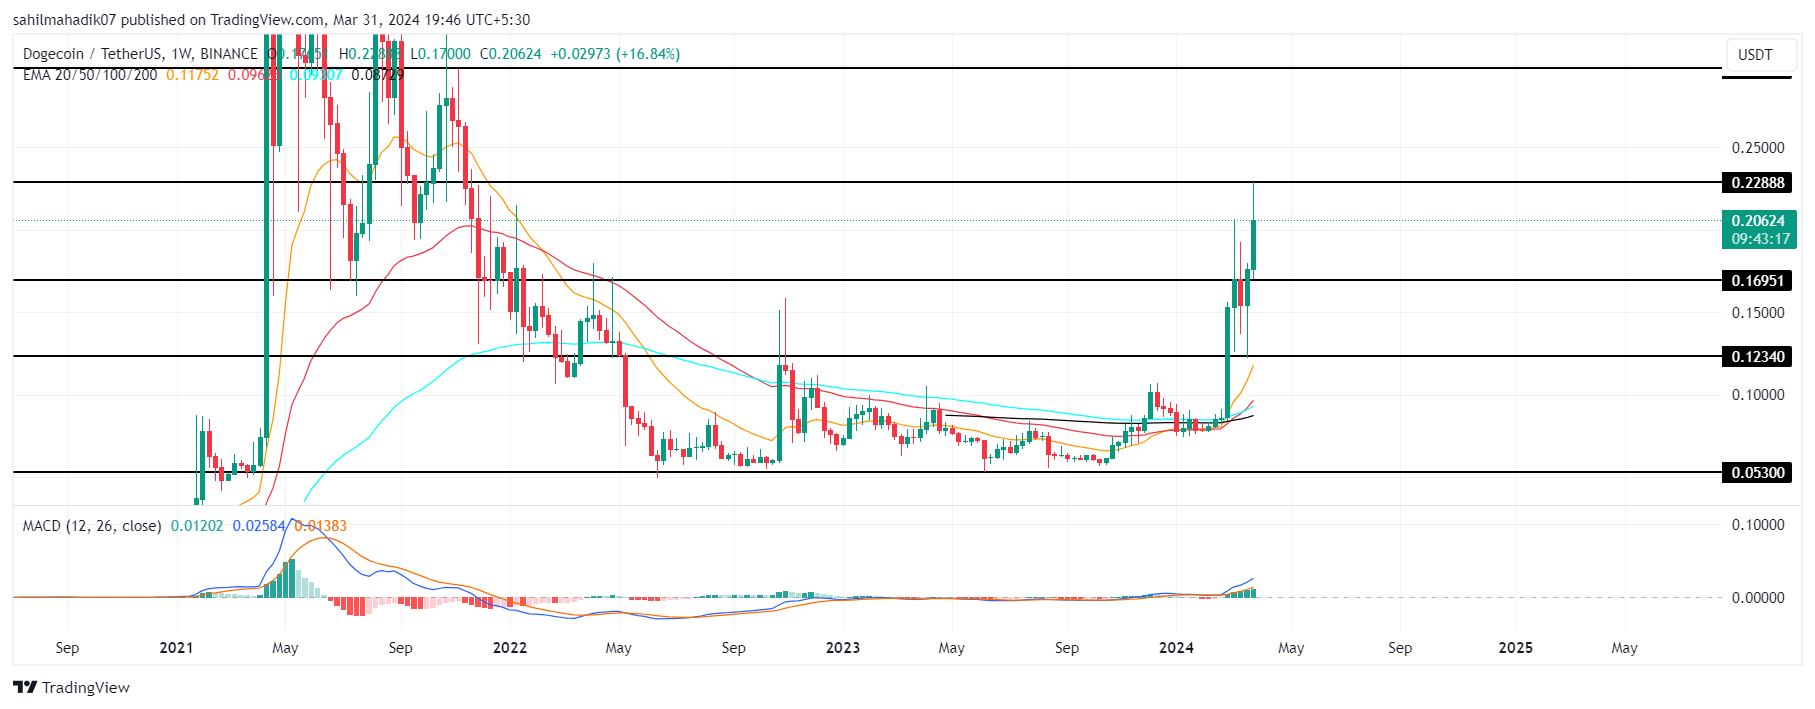
However, an analysis of the higher time frame chart shows parabolic growth resembling the formation of a rounding bottom pattern. The chart pattern is often considered a sign of a downtrend bottoming and an opportunity for a new bull run to emerge.
ただし、より高い時間枠チャートの分析では、丸みを帯びた底パターンの形成に似た放物線状の成長が示されています。チャートのパターンは、下降トレンドの底打ちと新たな強気相場が出現する機会の兆候とみなされることがよくあります。

Should the crypto market exhibit a bullish response to the anticipated halving, in line with historical trends and investor expectations, Dogecoin’s price is likely to align with the bullish pattern formation.
ドージコイン価格| Tradingview過去の傾向や投資家の期待に沿って、予想される半減期に対して仮想通貨市場が強気の反応を示した場合、ドージコインの価格は強気のパターン形成と一致する可能性が高い。
With sustained buying, the current rally may chase a potential target of $0.3, followed by $0.35 and $0.448.
買いが継続すれば、現在の上昇相場は0.3ドル、続いて0.35ドル、0.448ドルの潜在目標を追いかける可能性がある。
Also Read: Top Analyst Predicts Bitcoin To Hit $75K, But There’s A Catch
こちらもお読みください: トップアナリスト、ビットコインは7万5千ドルに達すると予測、しかし落とし穴もある
Technical Indicator
- Exponential Moving Average: A sharp upswing from the fast-moving 20-day EMA indicates a high momentum rally which usually favors breakout traders.
- Average Directional Index (ADX): The ADX slope at 41% indicates the overextended rally may need some pullbacks to regain strength.
テクニカル指標指数移動平均: 動きの速い20日間EMAからの急激な上昇は、通常、ブレイクアウトトレーダーに有利な高い勢いの上昇を示しています。平均方向性指数(ADX): 41%のADX傾きは、過度に伸びた上昇相場がある程度の引き戻しが必要である可能性があることを示しています。力を取り戻す。


 Crypto Daily™
 ETHNews
 Coin Edition
 DogeHome
 Crypto Daily™
 BlockchainReporter
 Crypto Daily™
 Crypto Daily™
 crypto.news


