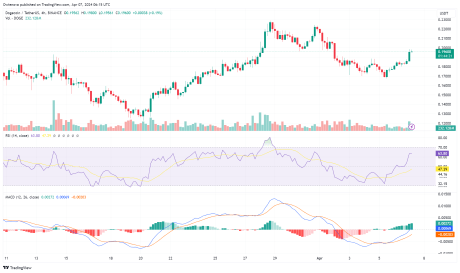
After a retracement from its current high of $0.22960, the price of Dogecoin (DOGE) looks like it is not yet done as the memecoin bounced back and moving toward its current high.
현재 최고치인 0.22960달러에서 되돌린 후, 도지코인(DOGE)의 가격은 밈코인이 반등하여 현재 최고치를 향해 움직이기 때문에 아직 끝나지 않은 것처럼 보입니다.
Dogecoin Price Technical Analysis
Dogecoin is one of the few memecoins that have captured the hearts of many crypto investors. Like Shiba Inu and Pepecoin (PEPE), Dogecoin is backed up by a strong and exciting community which has played a huge role in its success so far.
Dogecoin 가격 기술적 분석Dogecoin은 많은 암호화폐 투자자들의 마음을 사로잡은 몇 안 되는 밈코인 중 하나입니다. Shiba Inu 및 Pepecoin(PEPE)과 마찬가지로 Dogecoin은 지금까지 성공에 큰 역할을 해 온 강력하고 흥미로운 커뮤니티의 지원을 받습니다.
At the time of writing, the price of DOGE was trading around $0.19713 and was up by over 5% in the last 24 hours. Also, the price is currently trading above the 100-day moving average with very strong bullish momentum in the 4-hour timeframe.
이 글을 쓰는 시점에서 DOGE의 가격은 약 0.19713달러에 거래되고 있으며 지난 24시간 동안 5% 이상 상승했습니다. 또한 가격은 현재 4시간 동안 매우 강력한 강세 모멘텀을 보이며 100일 이동평균 위에서 거래되고 있습니다.
The MACD indicator in the 4-hour timeframe suggests an upward spike. This is so because the MACD line and the MACD signal that was trending below the zero line have both crossed, heading toward the MACD zero line.
4시간 단위의 MACD 지표는 상승 스파이크를 나타냅니다. 이는 MACD 선과 0선 아래에서 추세를 보이던 MACD 신호가 모두 교차하여 MACD 0선을 향하고 있기 때문입니다.
If the MACD line and the MACD signal line manage to cross above the MACD zero, Dogecoin might move higher to create a new high. Meanwhile, the MACD histogram is already trending above the zero line which suggests a bullish momentum.
MACD 라인과 MACD 신호 라인이 MACD 0 위로 교차하는 경우 Dogecoin은 더 높이 이동하여 새로운 최고점을 생성할 수 있습니다. 한편, MACD 히스토그램은 이미 강세 모멘텀을 시사하는 0선 위로 추세를 보이고 있습니다.

The Relative Strength Index (RSI) on the 4-hour timeframe also indicates a bullish momentum toward the upward direction as the RSI signal line has crossed above the 50% level and is heading towards the overbought zone. According to the RSI indicator, the strength of the upward movement is still very strong as buyers are still very active in the market.
4시간 단위의 상대강도지수(RSI)도 RSI 신호선이 50% 수준을 넘어 과매수 영역을 향하고 있기 때문에 상승 방향으로의 강세 모멘텀을 나타냅니다. RSI 지표에 따르면, 구매자가 여전히 시장에서 활발하게 활동하고 있기 때문에 상승세의 힘이 여전히 매우 강합니다.
Potential Retracement On The Downside
Given the price’s previous surge, two major resistance levels and one major support level were created around $0.22960, $0.2244, and $0.19622 respectively. If the price of DOGE manages to move above the resistance level of $0.22441 level, it might move even further upward toward the resistance level of $0.22960.
단점에 대한 잠재적 되돌림 이전 가격 급등을 고려하여 두 개의 주요 저항 수준과 하나의 주요 지원 수준이 각각 $0.22960, $0.2244 및 $0.19622 부근에 생성되었습니다. DOGE의 가격이 저항 수준 $0.22441 수준 위로 이동하면 저항 수준 $0.22960을 향해 더욱 상승할 수 있습니다.
At this point, if the price succeeds in breaking above this level, the price might surge higher to create a new high. On the other hand, if the price fails to break above this resistance level, the price might start a new downward movement toward its previous support level of $0.19622. However, a breakout below the $0.19622 level could trigger a new downward trend.
이 시점에서 가격이 이 수준을 넘어서는 데 성공하면 가격이 급등하여 새로운 최고점을 만들 수 있습니다. 반면, 가격이 이 저항선을 돌파하지 못하면 가격은 이전 지지선인 $0.19622를 향해 새로운 하향 움직임을 시작할 수 있습니다. 그러나 $0.19622 수준 아래로 돌파하면 새로운 하락 추세가 촉발될 수 있습니다.

1D 차트에서 DOGE 거래가 $0.19 | 출처: Tradingview.com의 DOGEUSDT iStock의 추천 이미지, Tradingview.com의 차트 주의사항: 이 기사는 교육 목적으로만 제공됩니다. 이는 투자를 구매, 판매 또는 보유할지 여부에 대한 NewsBTC의 의견을 대변하지 않으며 당연히 투자에는 위험이 따릅니다. 투자 결정을 내리기 전에 스스로 조사를 수행하는 것이 좋습니다. 이 웹사이트에 제공된 정보를 사용하는 데 따른 위험은 전적으로 귀하의 책임입니다. 태그: dogeCoindogeusddogeusdtMACDPEPEPepeCoin상대 강도 지수RSISHIBShiba Inu


 Optimisus
 TheCoinrise Media
 DogeHome
 Optimisus
 BH NEWS
 The Blockopedia
 COINTURK NEWS
 Crypto News Land


