After a retracement from its current high of $0.22960, the price of Dogecoin (DOGE) looks like it is not yet done as the memecoin bounced back and moving toward its current high.
在從當前高點 0.22960 美元回撤後,狗狗幣 (DOGE) 的價格似乎尚未完成,因為 memecoin 反彈並朝著當前高點移動。
Dogecoin Price Technical Analysis
Dogecoin is one of the few memecoins that have captured the hearts of many crypto investors. Like Shiba Inu and Pepecoin (PEPE), Dogecoin is backed up by a strong and exciting community which has played a huge role in its success so far.
狗狗幣價格技術分析狗狗幣是為數不多的擄獲許多加密貨幣投資者心的迷因幣之一。與 Shiba Inu 和 Pepecoin (PEPE) 一樣,Dogecoin 得到了強大而令人興奮的社區的支持,該社區迄今為止在其成功中發揮了巨大作用。
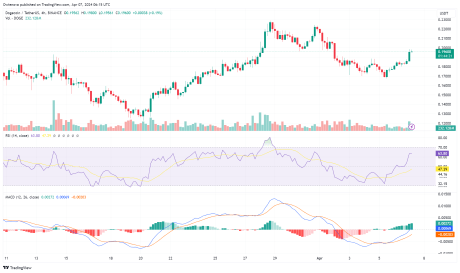
At the time of writing, the price of DOGE was trading around $0.19713 and was up by over 5% in the last 24 hours. Also, the price is currently trading above the 100-day moving average with very strong bullish momentum in the 4-hour timeframe.
截至撰寫本文時,DOGE 的價格約為 0.19713 美元,在過去 24 小時內上漲了 5% 以上。此外,價格目前交投於 100 日移動均線上方,4 小時時間範圍內看漲勢頭非常強勁。
The MACD indicator in the 4-hour timeframe suggests an upward spike. This is so because the MACD line and the MACD signal that was trending below the zero line have both crossed, heading toward the MACD zero line.
4 小時時間範圍內的 MACD 指標顯示上漲趨勢。這是因為 MACD 線和趨勢低於零線的 MACD 訊號都已交叉,朝向 MACD 零線移動。
If the MACD line and the MACD signal line manage to cross above the MACD zero, Dogecoin might move higher to create a new high. Meanwhile, the MACD histogram is already trending above the zero line which suggests a bullish momentum.
如果 MACD 線和 MACD 訊號線成功穿越 MACD 零線,狗狗幣可能會走高並創造新高。同時,MACD長條圖已經趨勢於零線上方,這表明看漲勢頭。

The Relative Strength Index (RSI) on the 4-hour timeframe also indicates a bullish momentum toward the upward direction as the RSI signal line has crossed above the 50% level and is heading towards the overbought zone. According to the RSI indicator, the strength of the upward movement is still very strong as buyers are still very active in the market.
4 小時時間範圍內的相對強弱指數 (RSI) 也顯示出向上的看漲勢頭,因為 RSI 訊號線已突破 50% 水平並正在走向超買區域。根據RSI指標,由於買家在市場上仍然非常活躍,因此上漲的力度仍然非常強勁。
Potential Retracement On The Downside
Given the price’s previous surge, two major resistance levels and one major support level were created around $0.22960, $0.2244, and $0.19622 respectively. If the price of DOGE manages to move above the resistance level of $0.22441 level, it might move even further upward toward the resistance level of $0.22960.
下行方面的潛在回調考慮到價格之前的飆升,兩個主要阻力位和一個主要支撐位分別在 0.22960 美元、0.2244 美元和 0.19622 美元附近創建。如果 DOGE 的價格成功突破 0.22441 美元的阻力位,它可能會進一步上漲至 0.22960 美元的阻力位。
At this point, if the price succeeds in breaking above this level, the price might surge higher to create a new high. On the other hand, if the price fails to break above this resistance level, the price might start a new downward movement toward its previous support level of $0.19622. However, a breakout below the $0.19622 level could trigger a new downward trend.
此時,如果價格成功突破該水平,價格可能會飆升並創造新高。另一方面,如果價格未能突破該阻力位,則價格可能會開始新的下行走勢,向先前的支撐位 0.19622 美元移動。然而,突破 0.19622 美元水準可能會引發新的下跌趨勢。

一維圖表上 DOGE 的交易價格為 0.19 美元 |來源:Tradingview.com 上的 DOGEUSDT 精選圖片來自 iStock,圖表來自 Tradingview.com 免責聲明:本文僅供教育目的。不代表NewsBTC是否購買、出售或持有任何投資的意見,投資自然有風險。建議您在做出任何投資決定之前進行自己的研究。使用本網站提供的資訊的風險完全由您自行承擔。標籤: dogeDogecoindogeusddogeusdtMACDPEPEPPepeCoin相對強度指數RSISHIBShiba Inu


 DogeHome
 Optimisus
 Crypto Intelligence
 BlockchainReporter
 Cryptopolitan_News
 DogeHome
 Crypto Intelligence
 Bitcoin Sistemi EN
 CoinsProbe


