

As the cryptocurrency market enters a period of consolidation and reevaluation, Ethereum's anticipated march toward the $5,000 mark seems to have paused. Investors are progressively derisking their portfolios, perhaps in anticipation of further market turbulence. The current sentiment is not necessarily a harbinger of doom but may suggest a strategic pullback.
암호화폐 시장이 통합과 재평가의 시기에 접어들면서 이더리움이 5,000달러 선을 향한 예상 행진이 멈춘 것으로 보입니다. 투자자들은 아마도 추가적인 시장 혼란을 예상하여 점진적으로 포트폴리오의 위험을 낮추고 있습니다. 현재의 정서는 반드시 파멸의 전조는 아니지만 전략적 후퇴를 암시할 수 있습니다.
Ethereum's chart suggests it is in the throes of a natural correction. After a sustained period of growth, marked by a series of higher highs, the price appears to be retracing toward key support levels.
이더리움의 차트는 그것이 자연적인 조정의 단계에 있음을 시사합니다. 일련의 고점을 기록하는 지속적인 성장 기간을 거친 후 가격은 주요 지원 수준으로 되돌아가는 것으로 보입니다.
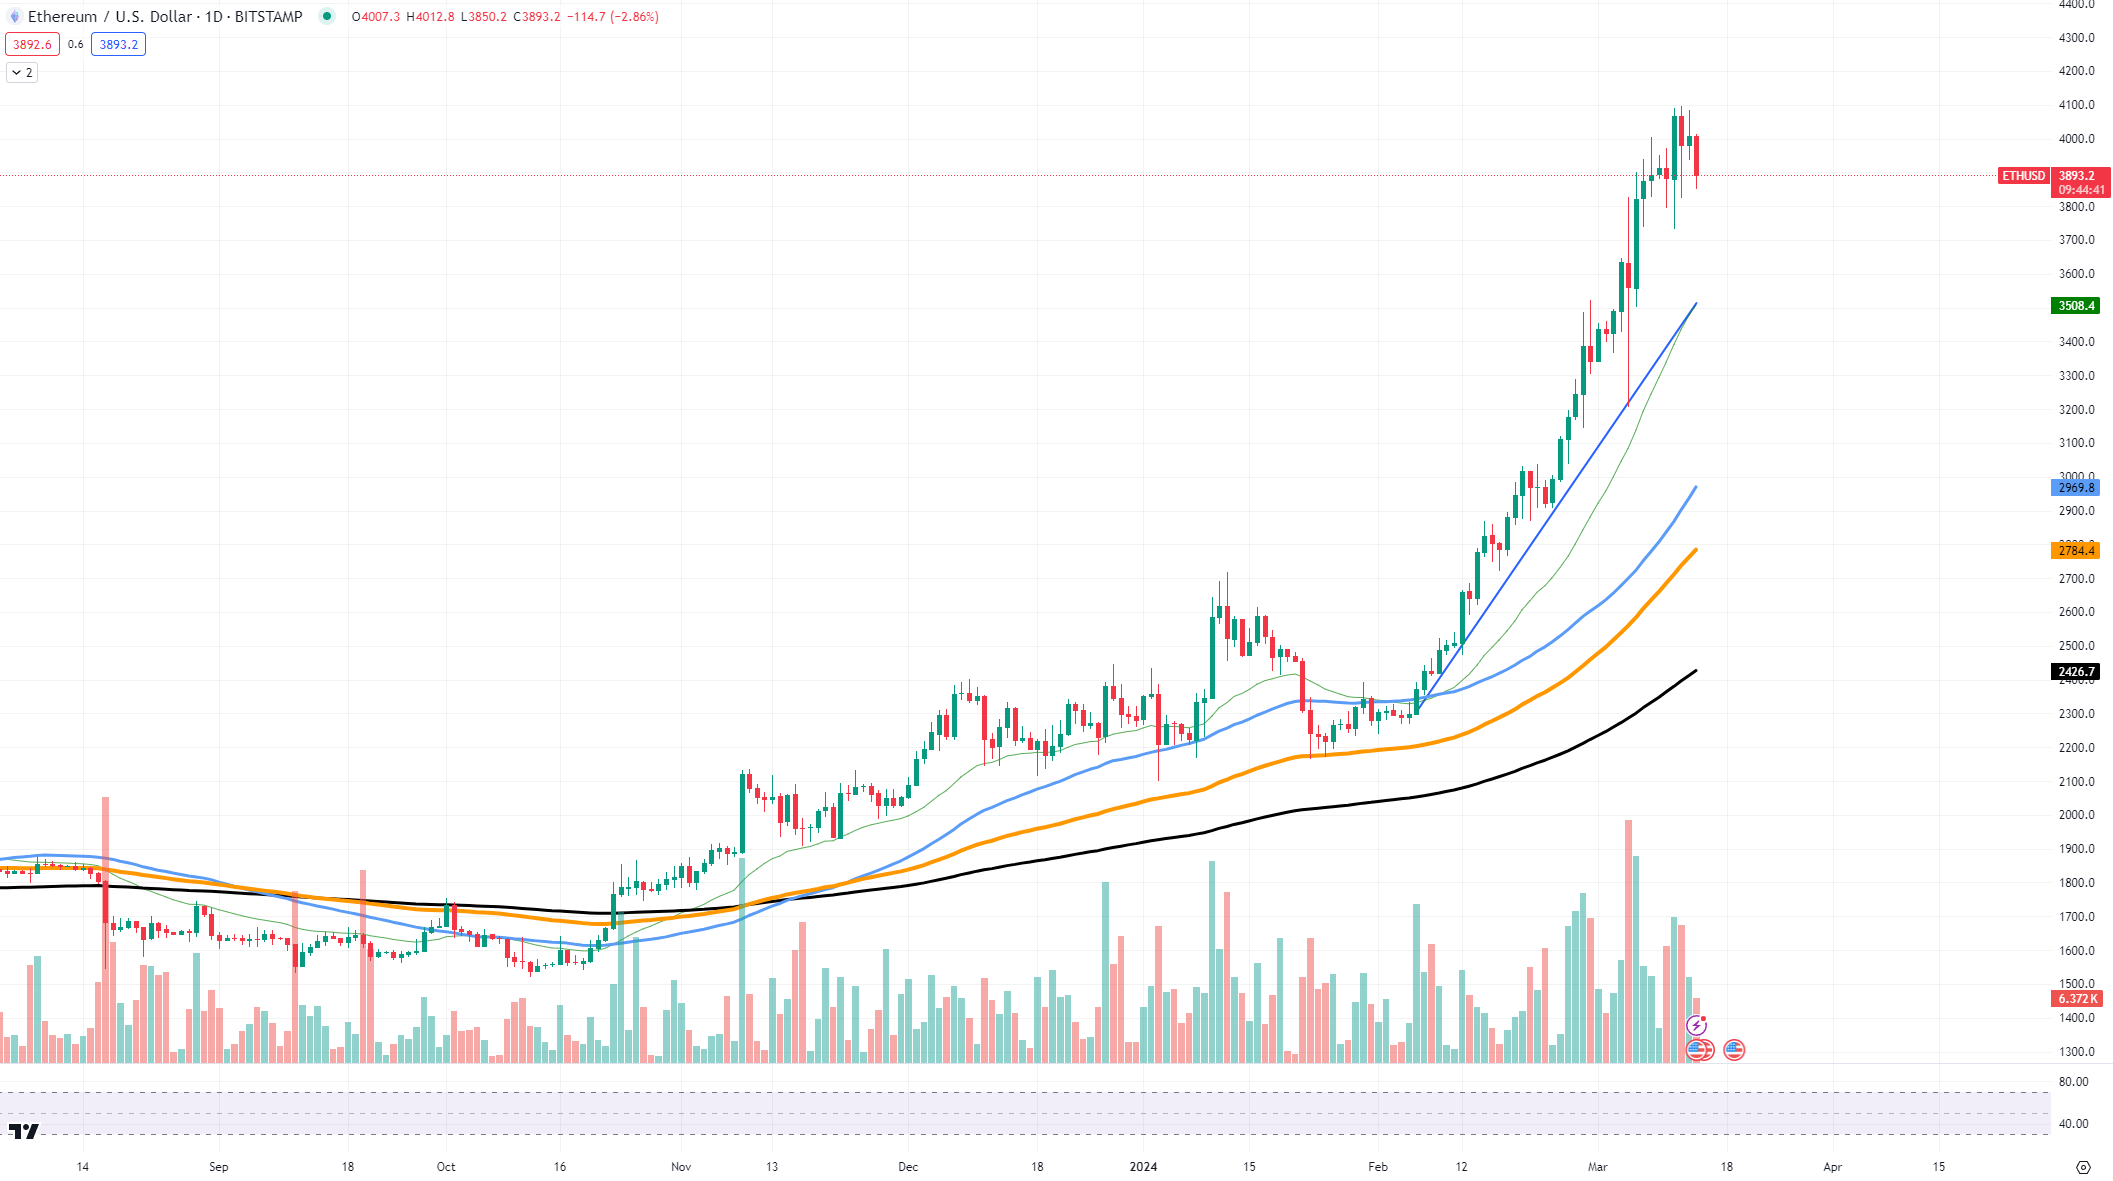 ETH/USD Chart by TradingView
TradingView ETH/USD 차트
These pullbacks are healthy in a bull market, allowing the asset to gather the necessary momentum for the next leg up. Technical indicators such as moving averages, which have provided support throughout the rally, are now being retested.
이러한 하락세는 강세장에서 건전하므로 자산이 다음 상승에 필요한 모멘텀을 모을 수 있습니다. 랠리 전반에 걸쳐 지지를 제공했던 이동 평균과 같은 기술 지표가 이제 다시 테스트되고 있습니다.
This cooling-off phase is characterized by a reduction in trading volume, indicating a decrease in immediate buying pressure. It also reflects the broader market sentiment, where the fear of a significant downturn prompts investors to lock in gains, resulting in a self-fulfilling prophecy of a temporary downtrend.
이 냉각 단계는 거래량이 감소하는 것이 특징이며 이는 즉각적인 구매 압력이 감소함을 나타냅니다. 이는 또한 상당한 경기 침체에 대한 두려움으로 인해 투자자들이 이익을 확보하고 일시적인 하락 추세에 대한 자체 실현 예언을 초래하는 광범위한 시장 정서를 반영합니다.
Bitcoin's path to $80,000
비트코인이 80,000달러를 향한 길
Bitcoin is approaching the psychological barrier of $80,000, but the current state of the market might not let it go through.
비트코인은 심리적 장벽인 80,000달러에 접근하고 있지만 현재 시장 상황으로 인해 이를 통과하지 못할 수도 있습니다.
Bitcoin's recent trajectory shows a climb toward this unprecedented level, with the asset exhibiting strong support near the $62,000 range. This support level is bolstered by the 50-day moving average, which historically acts as a dynamic foundation during bullish trends. The ascent has been accompanied by increasing trading volume, suggesting that the rally has substantial market participation and is not solely driven by speculative action.
비트코인의 최근 궤적은 이 전례 없는 수준으로의 상승을 보여 주며, 해당 자산은 62,000달러 범위 근처에서 강력한 지지를 보여줍니다. 이 지지 수준은 역사적으로 강세 추세에서 역동적인 기반 역할을 했던 50일 이동 평균에 의해 강화됩니다. 상승에는 거래량 증가가 동반되었으며, 이는 랠리가 상당한 시장 참여를 갖고 있으며 투기적 행위에 의해서만 주도되는 것이 아님을 시사합니다.
As BTC flirts with the $80,000 mark, resistance has formed near the $74,000 zone, where profit-taking has caused price retracements. The current price action indicates that Bitcoin is consolidating gains, often a prelude to a more decisive move. The resistance zone needs to be watched closely, as a breakout above it could signal the continuation of the bull run, whereas failure to breach could result in a price reversal.
BTC가 80,000달러 선을 노리면서 74,000달러 영역 근처에서 저항이 형성되어 이익실현으로 인해 가격 되돌림이 발생했습니다. 현재의 가격 움직임은 비트코인이 이익을 통합하고 있음을 나타내며, 이는 종종 보다 결정적인 움직임의 서곡입니다. 저항대를 돌파하면 강세 지속을 나타낼 수 있고, 저항대를 돌파하지 못하면 가격 반전이 발생할 수 있으므로 면밀히 관찰해야 합니다.
Furthermore, the RSI is hovering near overbought territory. This suggests that Bitcoin could be due for a temporary pullback as traders take profits and reassess their positions. A reversal from these levels may not be a full-fledged bearish turn but rather a healthy correction allowing the market to stabilize before its next leg up.
더욱이 RSI는 과매수권 근처에 머물고 있습니다. 이는 거래자들이 이익을 얻고 자신의 포지션을 재평가함에 따라 비트코인이 일시적으로 하락할 수 있음을 시사합니다. 이러한 수준의 반전은 본격적인 약세 전환이 아니라 오히려 시장이 다음 단계로 상승하기 전에 안정되도록 하는 건전한 조정일 수 있습니다.
The path to $80,000 is fraught with both anticipation and skepticism. If the local support levels hold steady amid market fluctuations, Bitcoin could potentially consolidate its position further, creating a launchpad for the coveted $80K target. However, if support falters, the asset may experience a sharper decline as part of its cyclical nature.
80,000달러를 향한 길은 기대와 회의로 가득 차 있습니다. 시장 변동 속에서 현지 지원 수준이 안정적으로 유지된다면 비트코인은 잠재적으로 그 위치를 더욱 강화하여 탐나는 $80,000 목표를 위한 발사대를 만들 수 있습니다. 그러나 지원이 약해지면 자산은 순환적 특성의 일부로 더 급격한 하락을 경험할 수 있습니다.
R0ally's dark horse
R0ally의 다크호스
While the limelight has been on assets like Ethereum (ETH), Dogecoin (DOGE) and Shiba Inu (SHIB), Binance Coin (BNB) has executed a stealthy 40% pump. BNB is often overlooked in favor of more media-centric cryptocurrencies, despite its robust fundamental use case and the utility within the Binance ecosystem.
Ethereum(ETH), Dogecoin(DOGE) 및 Shiba Inu(SHIB)와 같은 자산이 각광을 받는 동안 Binance Coin(BNB)은 은밀하게 40% 펌프를 실행했습니다. BNB는 강력한 기본 사용 사례와 바이낸스 생태계 내 유틸리티에도 불구하고 보다 미디어 중심적인 암호화폐를 선호하여 간과되는 경우가 많습니다.
The BNB chart reveals that the token has experienced significant bullish momentum, with a series of higher lows and higher highs indicating a strong uptrend. The price has recently rallied to a resistance level at around $600, which was previously untested, suggesting that traders are exploring new valuation territories.
BNB 차트는 토큰이 상당한 상승 모멘텀을 경험했음을 보여주며, 일련의 더 높은 저점과 더 높은 고점은 강력한 상승 추세를 나타냅니다. 가격은 최근 이전에 테스트되지 않은 약 $600의 저항 수준으로 반등하여 거래자가 새로운 가치 평가 영역을 탐색하고 있음을 시사합니다.
Local support levels for BNB can be identified near the $450 mark, where the 50-day moving average lies. This moving average has historically provided a dynamic support level during pullbacks, signaling areas where buying interest resurfaces. Moreover, the trading volume has seen a notable increase during the pump, implying genuine investor interest rather than a speculative spike.
BNB에 대한 현지 지원 수준은 50일 이동 평균이 있는 450달러 근처에서 확인할 수 있습니다. 이 이동 평균은 역사적으로 하락세 동안 동적 지지 수준을 제공하여 매수 관심이 다시 표면화되는 영역에 신호를 보냈습니다. 더욱이, 경기 상승 기간 동안 거래량이 눈에 띄게 증가했는데, 이는 투기적 급등보다는 진정한 투자자 관심을 의미합니다.
 DogeHome
 Cryptopolitan
 crypto.ro English
 Crypto News Land
 ETHNews
 CFN
CFN U_Today


