As the cryptocurrency market enters a period of consolidation and reevaluation, Ethereum's anticipated march toward the $5,000 mark seems to have paused. Investors are progressively derisking their portfolios, perhaps in anticipation of further market turbulence. The current sentiment is not necessarily a harbinger of doom but may suggest a strategic pullback.
仮想通貨市場が統合と再評価の時期に入る中、予想されていたイーサリアムの5,000ドルマークに向けた上昇はひと段落したようだ。おそらくさらなる市場の混乱を予想して、投資家は徐々にポートフォリオのリスクを回避しています。現在の感情は必ずしも破滅の前触れではないが、戦略的撤退を示唆している可能性がある。
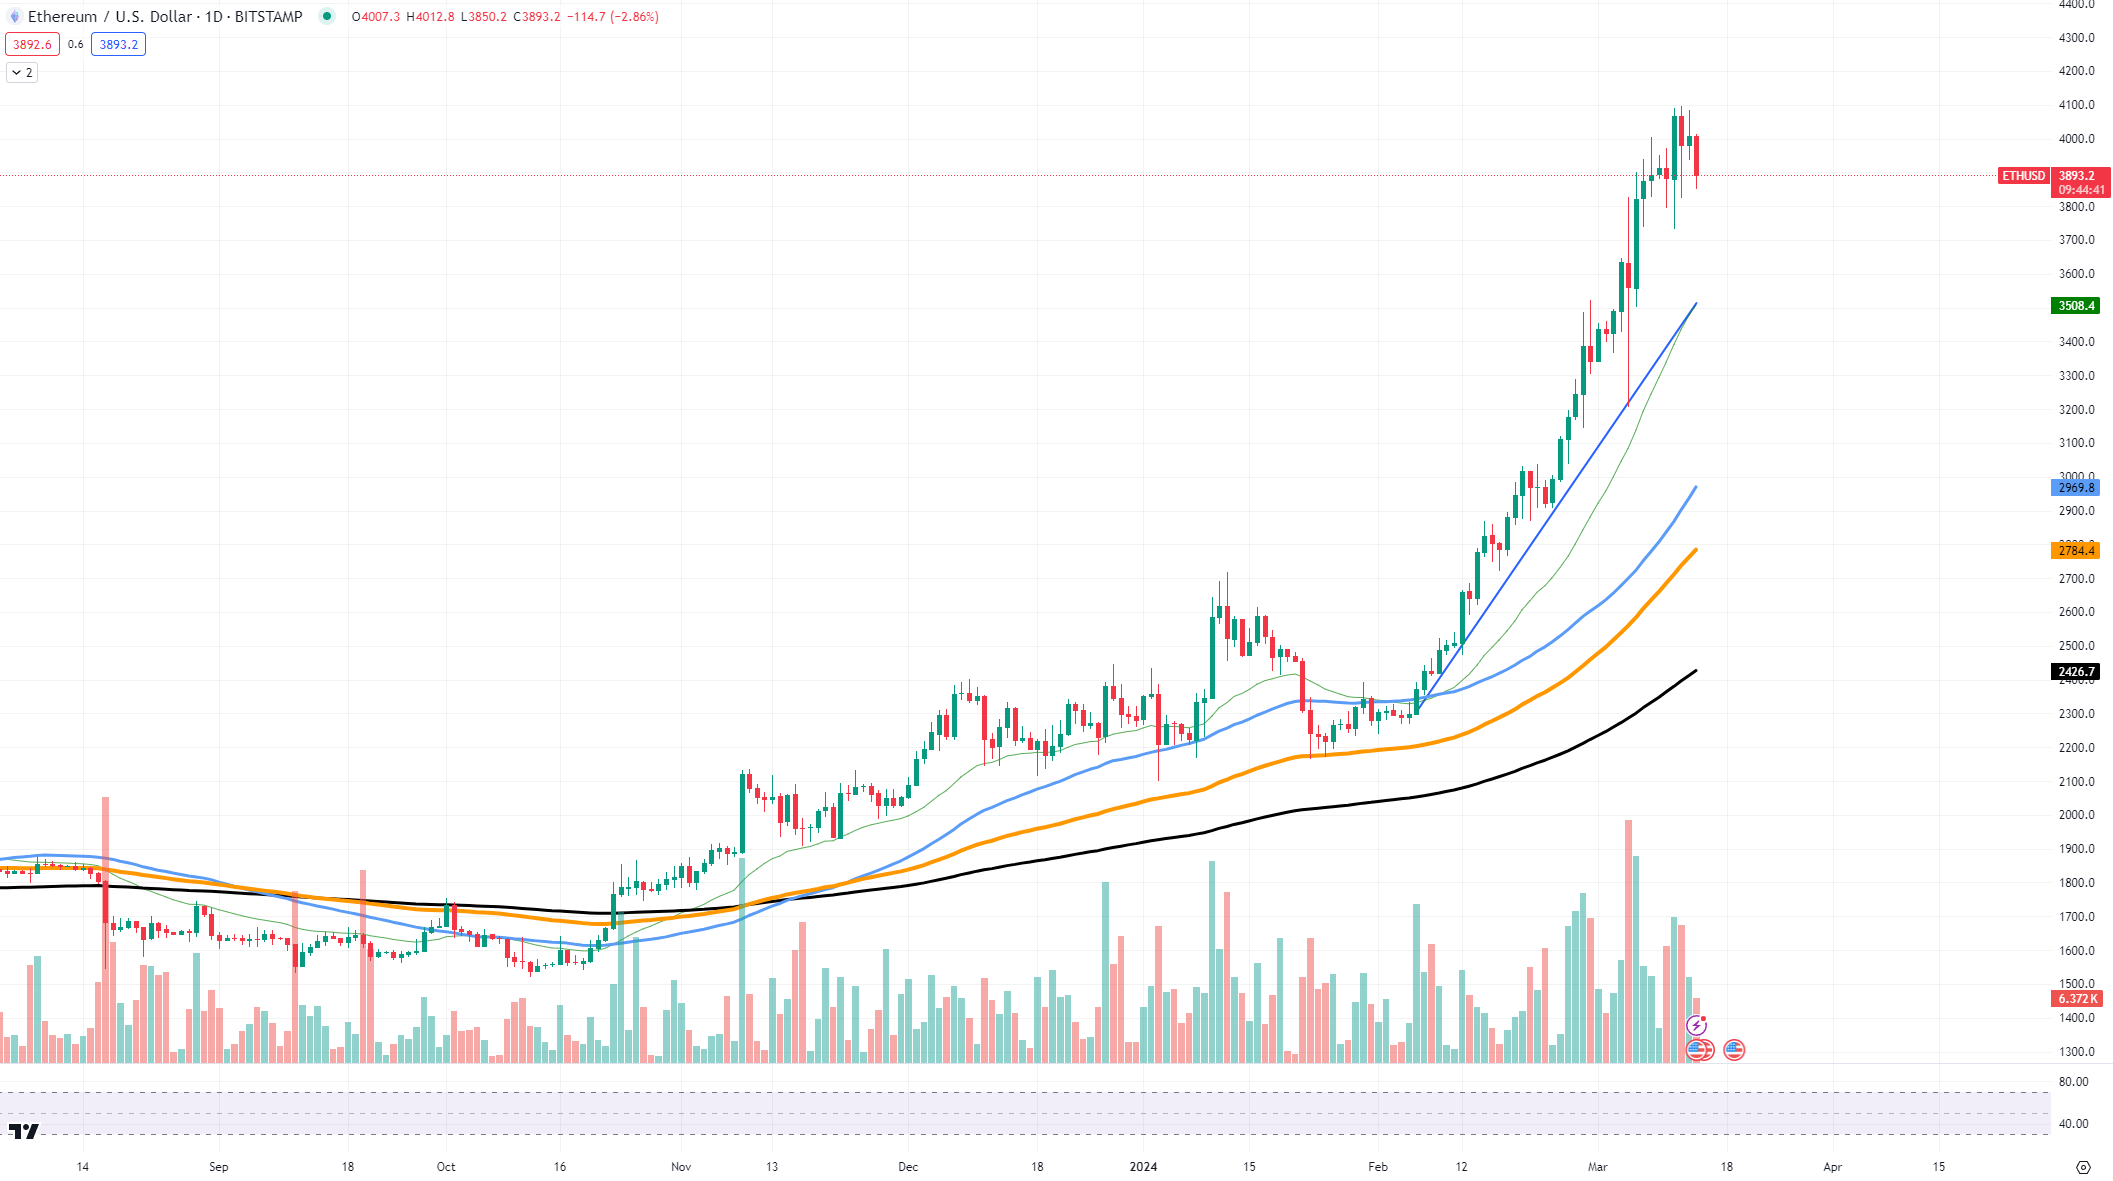
Ethereum's chart suggests it is in the throes of a natural correction. After a sustained period of growth, marked by a series of higher highs, the price appears to be retracing toward key support levels.
イーサリアムのチャートは、イーサリアムが自然調整の最中にあることを示唆している。一連の高値更新を特徴とする持続的な成長期間の後、価格は主要なサポートレベルに向けて逆戻りしているように見えます。
 ETH/USD Chart by TradingView
TradingViewによるETH/USDチャート
These pullbacks are healthy in a bull market, allowing the asset to gather the necessary momentum for the next leg up. Technical indicators such as moving averages, which have provided support throughout the rally, are now being retested.
こうした下落は強気市場では健全であり、資産が次の上昇に必要な勢いを集めることができます。上昇相場を通じてサポートを提供してきた移動平均などのテクニカル指標が現在、再試行されている。
This cooling-off phase is characterized by a reduction in trading volume, indicating a decrease in immediate buying pressure. It also reflects the broader market sentiment, where the fear of a significant downturn prompts investors to lock in gains, resulting in a self-fulfilling prophecy of a temporary downtrend.
この冷却段階は取引量の減少を特徴としており、即時購入圧力の低下を示しています。これはまた、大幅な景気後退への恐怖から投資家が利益を確定させ、その結果、一時的な下落トレンドの予測が自己実現するという、より広範な市場センチメントを反映している。
Bitcoin's path to $80,000
ビットコインの8万ドルへの道
Bitcoin is approaching the psychological barrier of $80,000, but the current state of the market might not let it go through.
ビットコインは8万ドルという心理的障壁に近づいているが、現在の市場状況ではそれを通過できない可能性がある。
Bitcoin's recent trajectory shows a climb toward this unprecedented level, with the asset exhibiting strong support near the $62,000 range. This support level is bolstered by the 50-day moving average, which historically acts as a dynamic foundation during bullish trends. The ascent has been accompanied by increasing trading volume, suggesting that the rally has substantial market participation and is not solely driven by speculative action.
ビットコインの最近の軌跡は、この前例のないレベルへの上昇を示しており、この資産は62,000ドルの範囲付近で強力なサポートを示しています。このサポートレベルは、歴史的に強気トレンドの際の動的な基盤として機能する50日移動平均によって強化されています。この上昇には取引高の増加も伴っており、この上昇にはかなりの市場参加者がおり、投機的行動のみによって引き起こされているわけではないことを示唆している。
As BTC flirts with the $80,000 mark, resistance has formed near the $74,000 zone, where profit-taking has caused price retracements. The current price action indicates that Bitcoin is consolidating gains, often a prelude to a more decisive move. The resistance zone needs to be watched closely, as a breakout above it could signal the continuation of the bull run, whereas failure to breach could result in a price reversal.
BTC が 80,000 ドルの水準を狙う中、74,000 ドルのゾーン付近で抵抗が形成され、利益確定により価格のリトレースメントが生じています。現在の価格動向は、ビットコインが利益を確定させていることを示しており、多くの場合、より決定的な動きへの前兆となります。レジスタンスゾーンを上抜ければ強気相場の継続を示す可能性がある一方、レジスタンスゾーンを突破できなければ価格が反転する可能性があるため、レジスタンスゾーンを注意深く監視する必要がある。
Furthermore, the RSI is hovering near overbought territory. This suggests that Bitcoin could be due for a temporary pullback as traders take profits and reassess their positions. A reversal from these levels may not be a full-fledged bearish turn but rather a healthy correction allowing the market to stabilize before its next leg up.
さらに、RSIは買われ過ぎ領域付近で推移している。これは、トレーダーが利益を得てポジションを再評価するにつれて、ビットコインが一時的に下落する可能性があることを示唆しています。これらの水準からの反転は本格的な弱気転換ではなく、むしろ次の上昇に向けて市場を安定させる健全な調整である可能性があります。
The path to $80,000 is fraught with both anticipation and skepticism. If the local support levels hold steady amid market fluctuations, Bitcoin could potentially consolidate its position further, creating a launchpad for the coveted $80K target. However, if support falters, the asset may experience a sharper decline as part of its cyclical nature.
8万ドルへの道には期待と懐疑の両方が伴います。市場変動の中でも現地のサポートレベルが安定していれば、ビットコインはその地位をさらに強化し、切望される8万ドルの目標に向けた発射台を生み出す可能性がある。ただし、サポートが弱まれば、その循環的な性質の一部として、資産はより急激な下落を経験する可能性があります。
R0ally's dark horse
R0allyのダークホース
While the limelight has been on assets like Ethereum (ETH), Dogecoin (DOGE) and Shiba Inu (SHIB), Binance Coin (BNB) has executed a stealthy 40% pump. BNB is often overlooked in favor of more media-centric cryptocurrencies, despite its robust fundamental use case and the utility within the Binance ecosystem.
イーサリアム(ETH)、ドージコイン(DOGE)、柴犬(SHIB)などの資産が脚光を浴びている一方で、バイナンスコイン(BNB)は密かに40%ポンプを実行しました。 BNB は、Binance エコシステム内での堅牢な基本的なユースケースと有用性にもかかわらず、よりメディア中心の暗号通貨を支持して無視されることがよくあります。
The BNB chart reveals that the token has experienced significant bullish momentum, with a series of higher lows and higher highs indicating a strong uptrend. The price has recently rallied to a resistance level at around $600, which was previously untested, suggesting that traders are exploring new valuation territories.
BNB チャートは、トークンが大幅な強気の勢いを示しており、一連の安値と高値の上昇が強い上昇傾向を示していることを示しています。価格は最近、これまでテストされていなかった約600ドルの抵抗水準まで回復しており、トレーダーが新たな評価領域を模索していることを示唆している。
Local support levels for BNB can be identified near the $450 mark, where the 50-day moving average lies. This moving average has historically provided a dynamic support level during pullbacks, signaling areas where buying interest resurfaces. Moreover, the trading volume has seen a notable increase during the pump, implying genuine investor interest rather than a speculative spike.
BNBのローカルサポートレベルは、50日移動平均がある450ドル付近で特定できます。この移動平均は歴史的に、下落時に動的なサポートレベルを提供し、買いの関心が再び表面化する領域を示してきました。さらに、取引量はポンプ期間中に顕著に増加しており、投機的な急増ではなく、純粋な投資家の関心を示唆しています。


 Coincu
 Optimisus
 Crypto Intelligence
 DogeHome
 Coincu
 Times Tabloid
 CFN
CFN Crypto News Land
 Optimisus


