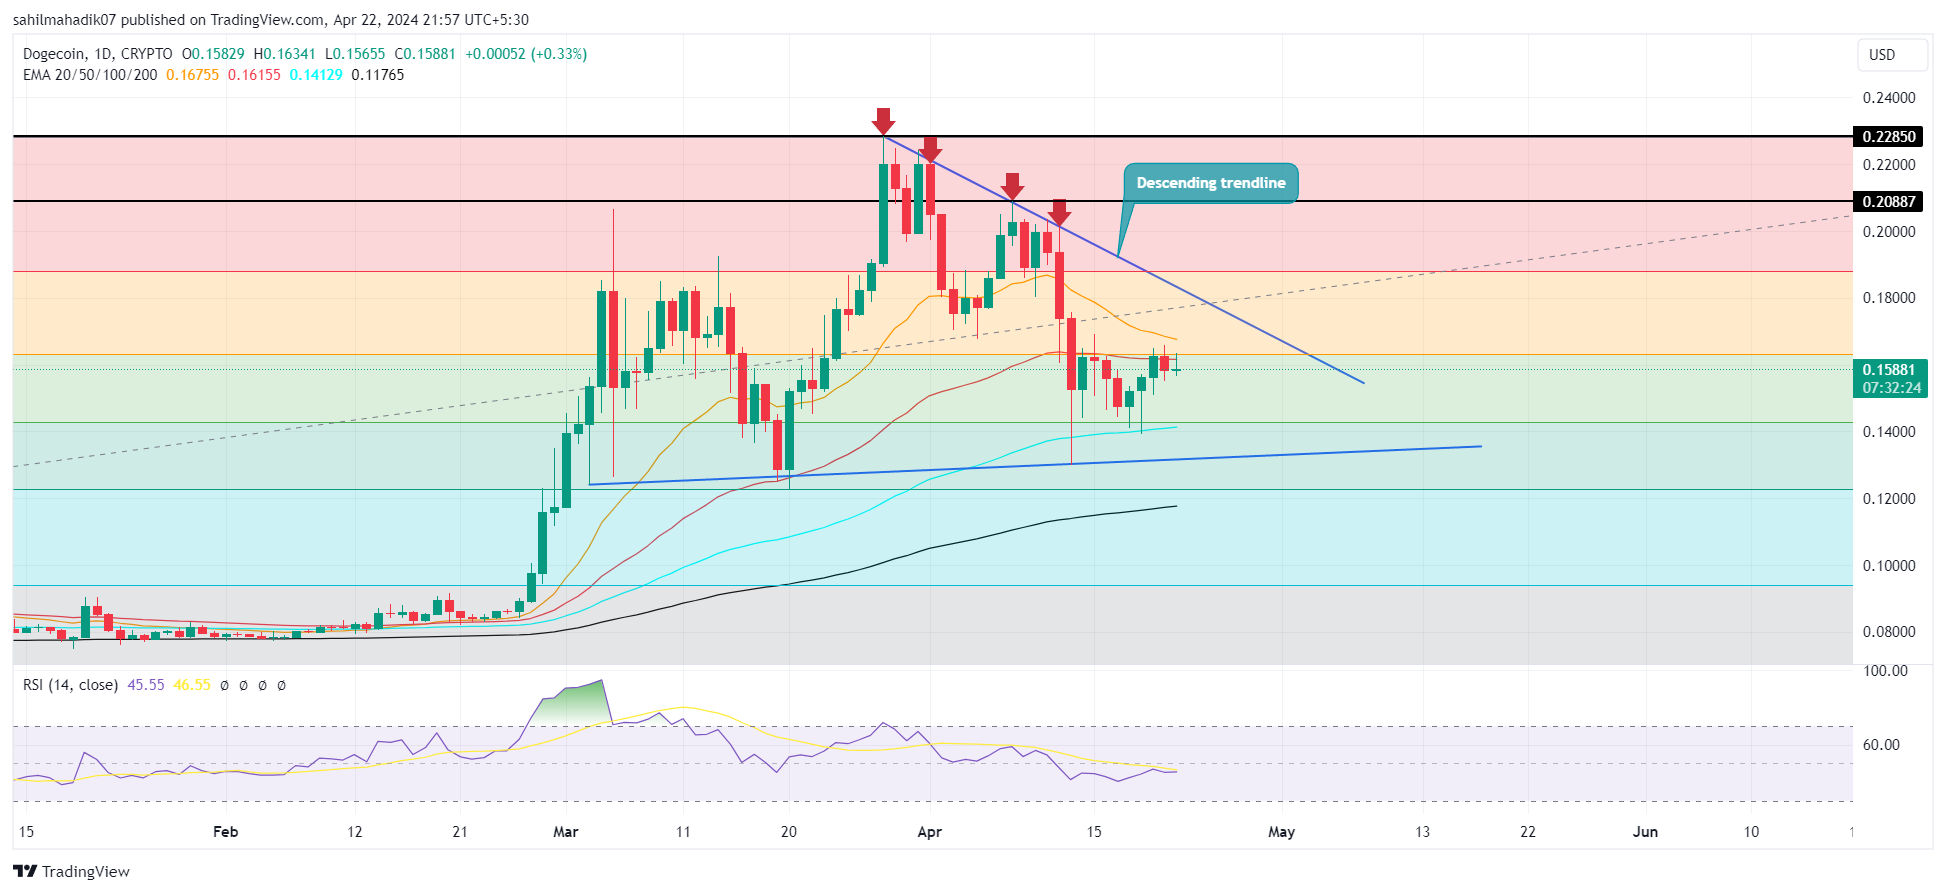
Dogecoin Price Analysis: DOGE, the largest meme cryptocurrency by market cap recently rebounded from the 50% retracement level at $0.14, following the completion of the fourth Bitcoin halving. On Monday, the BTC price reclaimed $65000 support triggering a relief recovery in the broader market. Will the post-halving rally bolster the Dogecoin price to surpass the $0.2 barrier?
Dogecoin 가격 분석: 시가총액 기준 최대 규모의 밈 암호화폐인 DOGE는 네 번째 비트코인 반감기가 완료된 후 최근 50% 되돌림 수준인 $0.14에서 반등했습니다. 월요일에 BTC 가격은 65,000달러의 지지를 되찾았고 더 넓은 시장에서 안도감 회복을 촉발했습니다. 반감기 이후 랠리가 Dogecoin 가격을 강화하여 0.2달러 장벽을 넘어설까요?
또한 읽으십시오: Sagemate는 Toncoin을 15달러로 예측하고 KangaMoon이 인상적인 가격 랠리를 유지함에 따라 Tami Crypto는 Dogecoin에 대해 낙관적입니다.
Will DOGE Price Reversal Surpass $0.2?
DOGE 가격 반전이 $0.2를 넘어설까요?

In the week of the fourth Bitcoin Halving, the Dogecoin price bottomed its current correction trend at the confluence of 50% Fibonacci retracement level and $0.14 support. The renewed demand pressure has uplifted the DOGE price by 12.2% within five days to currently trade at $0.158.
네 번째 비트코인 반감기가 있는 주에 Dogecoin 가격은 50% 피보나치 되돌림 수준과 $0.14 지지선이 합류하면서 현재 조정 추세를 바닥으로 내렸습니다. 새로운 수요 압력으로 인해 DOGE 가격은 5일 이내에 12.2% 상승하여 현재 $0.158에 거래되고 있습니다.
If the buying momentum persists, the DOGE price is poised for another 10% surge and challenges the downsloping trendline which led to the current correction trend. A successful breakout above this barrier will signal an end-of-correction trend and bolster buyers for higher rallies.
매수 모멘텀이 지속된다면 DOGE 가격은 추가로 10% 급등할 준비가 되어 있으며 현재 조정 추세를 가져온 하향 추세선에 도전하게 됩니다. 이 장벽을 성공적으로 돌파하면 조정 추세가 끝났음을 알리고 구매자가 더 높은 랠리를 펼칠 수 있게 됩니다.
A post-breakout rally could chase a potential target of $0.2, followed by $0.22.
탈주 후 랠리는 잠재적인 목표인 $0.2와 $0.22를 추적할 수 있습니다.
Also Read: Analysts Back Dogecoin to $1 With Traders Also Bullish On New Dogeverse Meme Coin
또한 읽으십시오: 분석가들은 트레이더들과 함께 Dogecoin을 1달러로 되돌리고 새로운 Dogeverse Meme 코인에 대해서도 낙관합니다
Analyst Highlights Key Technical Pattern for Dogecoin’s Bullish Outlook
분석가는 Dogecoin의 강세 전망에 대한 주요 기술 패턴을 강조합니다
Renowned crypto trader Alicharts has shared an intriguing chart pattern for Dogecoin, hinting at its potential trajectory. According to the analysis, Dogecoin has recently broken out of a descending triangle formation, a technical indicator that traders often interpret as a bullish sign.
유명한 암호화폐 거래자 Alicharts는 Dogecoin의 흥미로운 차트 패턴을 공유하여 잠재적인 궤적을 암시했습니다. 분석에 따르면 Dogecoin은 최근 거래자들이 종종 강세 신호로 해석하는 기술적 지표인 하강 삼각형 형성을 벗어났습니다.
#Dogecoin is showing its classic pattern once again! $DOGE is currently consolidating after breaking out from a descending triangle.
#도지코인이 다시 한 번 클래식한 패턴을 보여주고 있습니다! $DOGE는 현재 하강 삼각형에서 벗어난 후 통합되고 있습니다.
Based on past trends, we might just see #DOGE rocket towards $1 in the coming weeks! pic.twitter.com/dEWeVWLIHR
과거 추세에 따르면 앞으로 몇 주 안에 #DOGE 로켓이 1달러를 향해 나아가는 것을 볼 수 있습니다! pic.twitter.com/dEWeVWLIHR
— Ali (@ali_charts) April 21, 2024
— 알리(@ali_charts) 2024년 4월 21일
Based on historical trends, the DOGE price has exhibited this pattern on two previous occasions, each preceding significant bull runs. If these patterns continue to be reliable indicators, Dogecoin might be poised for an aggressive ascent toward the $1 threshold in the forthcoming weeks.
역사적 추세를 바탕으로 DOGE 가격은 이전 두 차례에 걸쳐 상당한 강세장 이전에 이러한 패턴을 보였습니다. 이러한 패턴이 계속해서 신뢰할 수 있는 지표가 된다면 Dogecoin은 앞으로 몇 주 안에 1달러 임계값을 향해 공격적으로 상승할 준비가 되어 있을 수 있습니다.
Technical Indicator
기술 지표
- Exponential Moving Average: The DOGE price rebounded from the 100-day EMA slope, indicating the border on this asset remains bullish.
- Relative Strength Index: The daily RSI slope reverted to a neutral zone reflecting a positive shift in market sentiment.
지수 이동 평균: DOGE 가격이 100일 EMA 기울기에서 반등하여 이 자산의 경계가 여전히 강세임을 나타냅니다.
상대 강도 지수: 일일 RSI 기울기는 시장 정서의 긍정적인 변화를 반영하여 중립 영역으로 되돌아갔습니다.
The post Historical Patterns Hints Dogecoin Price May Target $1 in Upcoming Weeks appeared first on CoinGape.
포스트 역사적 패턴 힌트 Dogecoin 가격은 향후 몇 주 동안 1달러를 목표로 삼을 수 있음이 CoinGape에 처음 나타났습니다.


 Coincu
 Coin Edition
 DogeHome
 Coin_Gabbar
 Coincu
 BlockchainReporter
 CoinPedia News
 TheNewsCrypto


