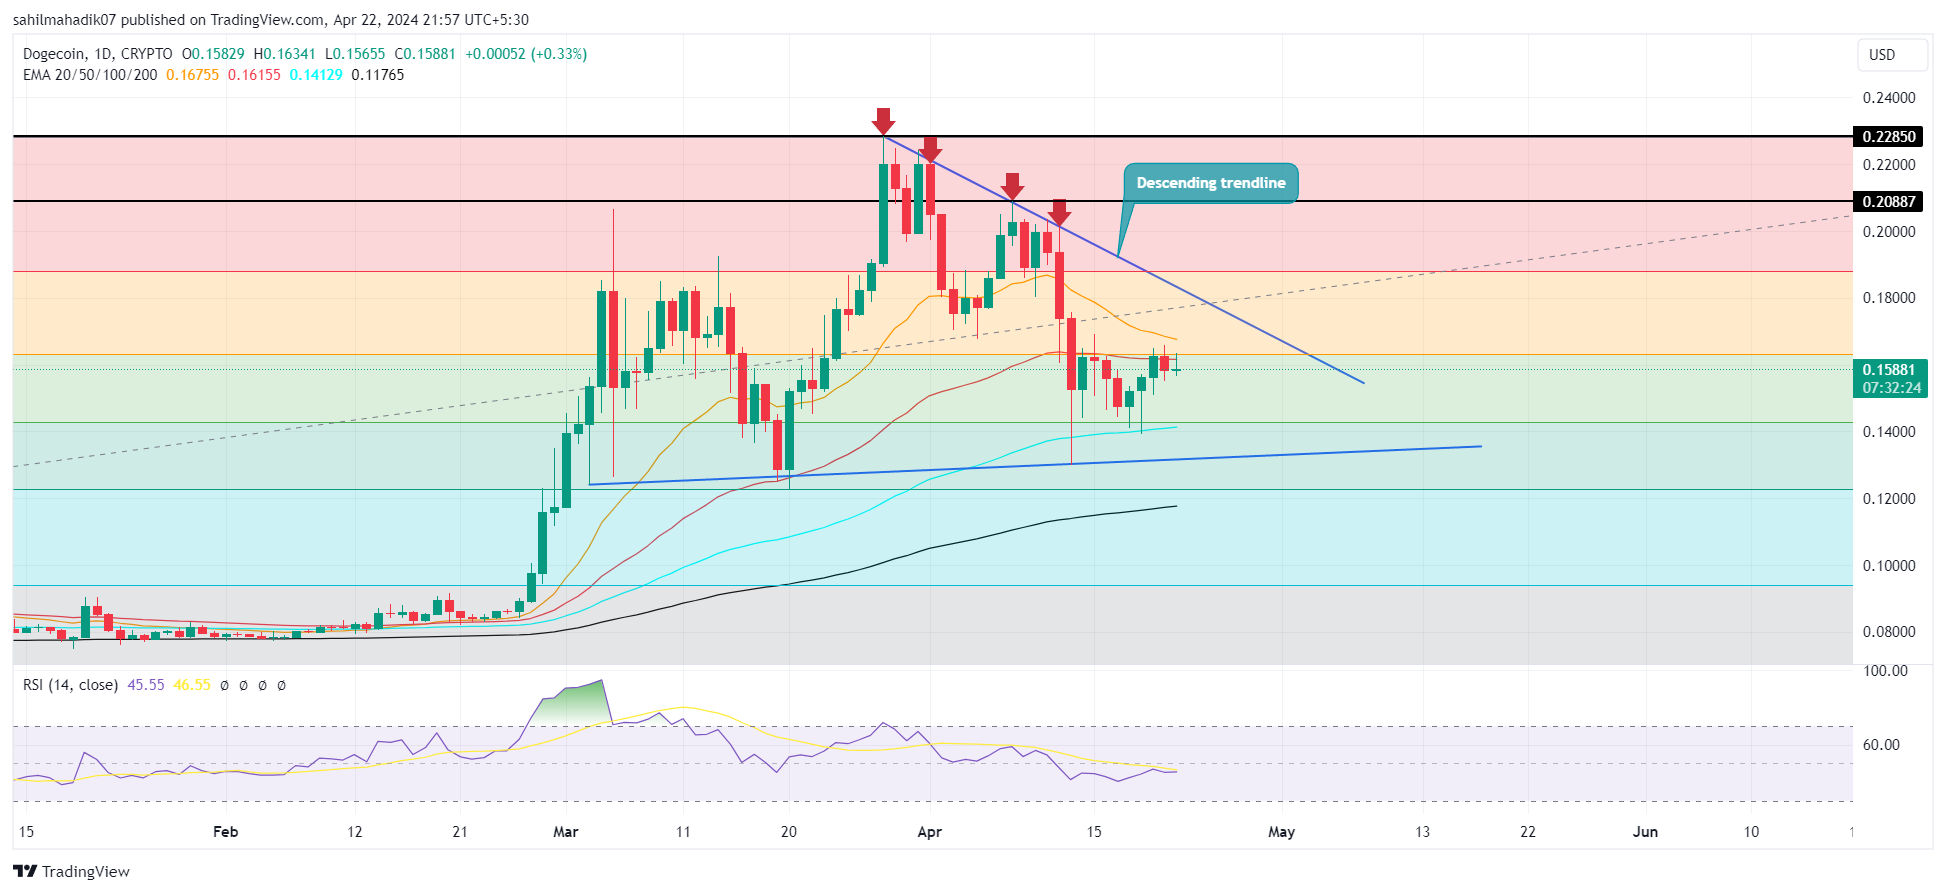
Dogecoin Price Analysis: DOGE, the largest meme cryptocurrency by market cap recently rebounded from the 50% retracement level at $0.14, following the completion of the fourth Bitcoin halving. On Monday, the BTC price reclaimed $65000 support triggering a relief recovery in the broader market. Will the post-halving rally bolster the Dogecoin price to surpass the $0.2 barrier?
ドージコイン価格分析: 時価総額で最大のミーム暗号通貨であるドージは、ビットコインの4回目の半減期の完了を受けて、最近0.14ドルで50%のリトレースメント水準から回復しました。月曜日、BTC価格は65000ドルのサポートを取り戻し、市場全体で安心感のある回復を引き起こしました。半減期後の上昇でドージコインの価格は0.2ドルの壁を超えるだろうか?
こちらもお読みください: KangaMoon が驚異的な価格上昇を維持する中、Sagemate はトンコインを 15 ドルに予測、Tami Crypto はドージコインに強気
Will DOGE Price Reversal Surpass $0.2?
DOGE価格反転は0.2ドルを超えるでしょうか?

In the week of the fourth Bitcoin Halving, the Dogecoin price bottomed its current correction trend at the confluence of 50% Fibonacci retracement level and $0.14 support. The renewed demand pressure has uplifted the DOGE price by 12.2% within five days to currently trade at $0.158.
4回目のビットコイン半減期の週、ドージコイン価格は50%フィボナッチ・リトレースメント・レベルと0.14ドルのサポートの合流点で現在の調整トレンドの底を打った。新たな需要圧力により、DOGE価格は5日間以内に12.2%上昇し、現在0.158ドルで取引されています。
If the buying momentum persists, the DOGE price is poised for another 10% surge and challenges the downsloping trendline which led to the current correction trend. A successful breakout above this barrier will signal an end-of-correction trend and bolster buyers for higher rallies.
買いの勢いが続けば、DOGE価格はさらに10%上昇する態勢が整い、現在の調整トレンドにつながった下降トレンドラインに挑戦することになる。この障壁を突破することに成功すれば、調整傾向の終わりを示し、買い手がさらなる上昇に向けて刺激を受けることになるだろう。
A post-breakout rally could chase a potential target of $0.2, followed by $0.22.
ブレイクアウト後の上昇は、潜在的な目標である0.2ドルを追い、その次に0.22ドルを追う可能性がある。
Also Read: Analysts Back Dogecoin to $1 With Traders Also Bullish On New Dogeverse Meme Coin
こちらもお読みください:アナリストはドージコインを1ドルに戻し、トレーダーも新しいドージバースミームコインに強気
Analyst Highlights Key Technical Pattern for Dogecoin’s Bullish Outlook
アナリストがドージコインの強気見通しの主要なテクニカルパターンを強調
Renowned crypto trader Alicharts has shared an intriguing chart pattern for Dogecoin, hinting at its potential trajectory. According to the analysis, Dogecoin has recently broken out of a descending triangle formation, a technical indicator that traders often interpret as a bullish sign.
有名な仮想通貨トレーダーの Alicharts は、ドージコインの興味深いチャートパターンを共有し、その潜在的な軌道を示唆しています。分析によると、ドージコインは最近、トレーダーが強気のサインとして解釈することが多いテクニカル指標である下降トライアングルの形成を抜け出した。
#Dogecoin is showing its classic pattern once again! $DOGE is currently consolidating after breaking out from a descending triangle.
#Dogecoin が再びその古典的なパターンを示しています! $DOGE は現在、下降トライアングルを突破した後、堅調に推移しています。
Based on past trends, we might just see #DOGE rocket towards $1 in the coming weeks! pic.twitter.com/dEWeVWLIHR
過去の傾向に基づくと、#DOGE は今後数週間のうちに 1 ドルに向かって急騰する可能性があります。 pic.twitter.com/dEWeVWLIHR
— Ali (@ali_charts) April 21, 2024
— アリ (@ali_charts) 2024年4月21日
Based on historical trends, the DOGE price has exhibited this pattern on two previous occasions, each preceding significant bull runs. If these patterns continue to be reliable indicators, Dogecoin might be poised for an aggressive ascent toward the $1 threshold in the forthcoming weeks.
過去の傾向に基づくと、DOGE 価格は過去 2 回このパターンを示しており、それぞれが大幅な強気相場に先立ちました。これらのパターンが引き続き信頼できる指標である場合、ドージコインは今後数週間で1ドルの基準に向けて積極的に上昇する準備ができている可能性があります。
Technical Indicator
テクニカル指標
- Exponential Moving Average: The DOGE price rebounded from the 100-day EMA slope, indicating the border on this asset remains bullish.
- Relative Strength Index: The daily RSI slope reverted to a neutral zone reflecting a positive shift in market sentiment.
指数移動平均: DOGE 価格は 100 日 EMA の傾きから反発し、この資産の境界が依然として強気であることを示しています。
相対力指数: 市場センチメントの前向きな変化を反映して、毎日の RSI の傾きは中立ゾーンに戻りました。
The post Historical Patterns Hints Dogecoin Price May Target $1 in Upcoming Weeks appeared first on CoinGape.
この投稿は、歴史的パターンが示唆するドージコイン価格が今後数週間で 1 ドルを目標にする可能性があることを示唆しており、最初に CoinGape に掲載されました。


 ItsBitcoinWorld
 Cryptopolitan_News
 U_Today
 Cryptopolitan_News
 DT News
 Cryptopolitan_News
 Thecryptoupdates
 DogeHome
 Coincu


