

You can also read this news on COINTURK NEWS: Insights on Cryptocurrency Market: Analysis of Altcoins and Their Potential Moves
COINTURK NEWS: 암호화폐 시장에 대한 통찰: 알트코인 분석 및 잠재적 움직임에서도 이 뉴스를 읽을 수 있습니다.
In the cryptocurrency market, altcoin projects are gaining momentum under the leadership of Bitcoin. During this period, even though blockchain ecosystems and meme coin projects are somewhat overshadowed by artificial intelligence projects, they continue to please their investors. So, what is expected for SOL, ADA, DOGE, and SHIB in the coming period? We examine this with detailed chart analyses.
암호화폐 시장에서는 비트코인을 중심으로 알트코인 프로젝트가 추진력을 얻고 있습니다. 이 기간 동안 블록체인 생태계와 밈 코인 프로젝트는 인공지능 프로젝트에 의해 다소 가려졌음에도 불구하고 계속해서 투자자를 기쁘게 합니다. 그렇다면 향후 SOL, ADA, DOGE 및 SHIB에 대해 예상되는 것은 무엇입니까? 우리는 상세한 차트 분석을 통해 이를 조사합니다.
Solana Chart Analysis
솔라나 차트 분석
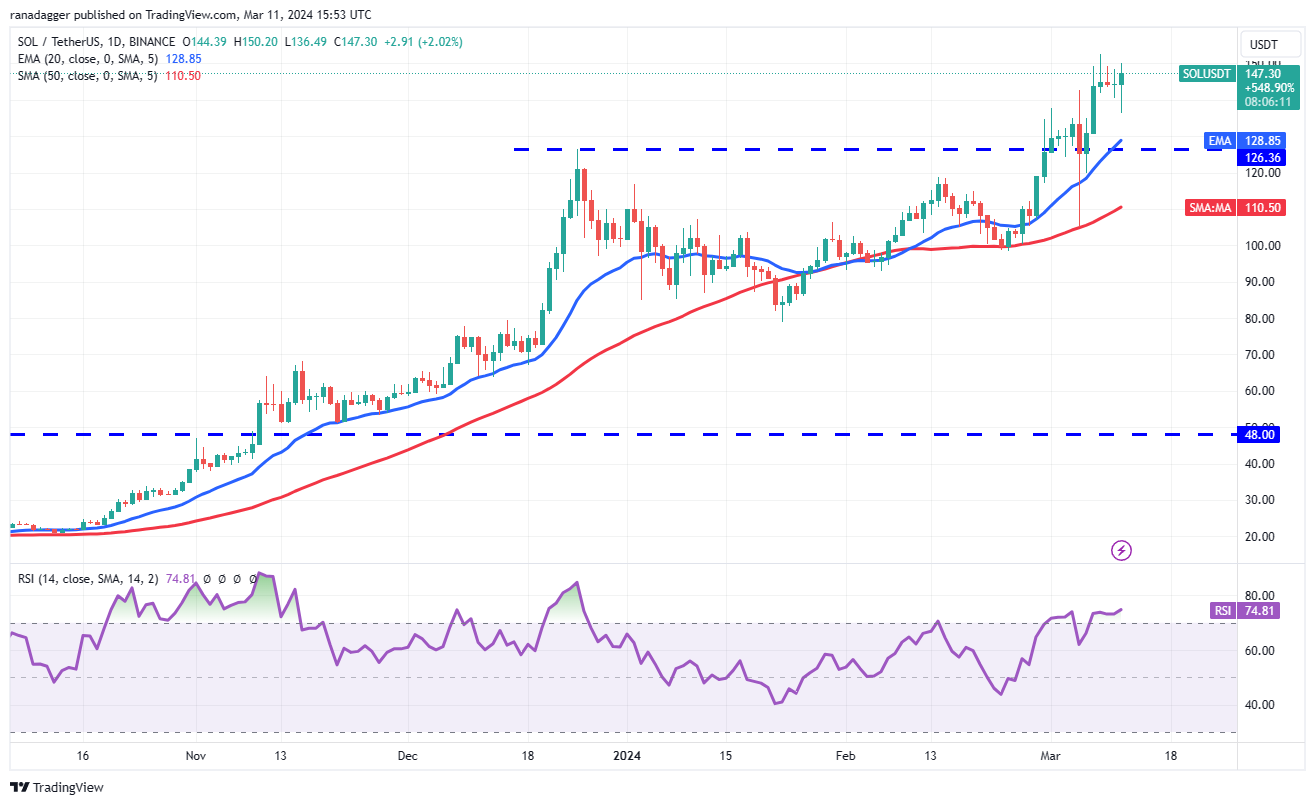
Bears are trying to initiate a correction in Solana, but the bulls have no intention of easing up. The shallow pullback once again indicates a lack of sellers. Buyers will try to take advantage of the situation and push the price above $153 to strengthen their positions. If they succeed, the SOL/USDT pair may continue its uptrend. The pair could then rise to $184.
하락세는 솔라나에서 조정을 시도하고 있지만 상승세는 누그러질 생각이 없습니다. 얕은 하락은 다시 한번 판매자가 부족함을 나타냅니다. 구매자는 상황을 이용하여 가격을 153달러 이상으로 올려 포지션을 강화하려고 노력할 것입니다. 성공할 경우 SOL/USDT 쌍은 상승 추세를 이어갈 수 있습니다. 그러면 그 쌍은 $184까지 상승할 수 있습니다.
If bears want to block the upward movement, they need to quickly pull the price below the $126 breakout level. This could accelerate sales and open the doors for a drop to the 50-day SMA average of $110.
하락세가 상승세를 막고 싶다면 가격을 $126 돌파 수준 아래로 빠르게 끌어내야 합니다. 이로 인해 판매가 가속화되고 50일 SMA 평균 $110로 하락할 수 있는 문이 열릴 수 있습니다.
Cardano Chart Analysis
카르다노 차트 분석
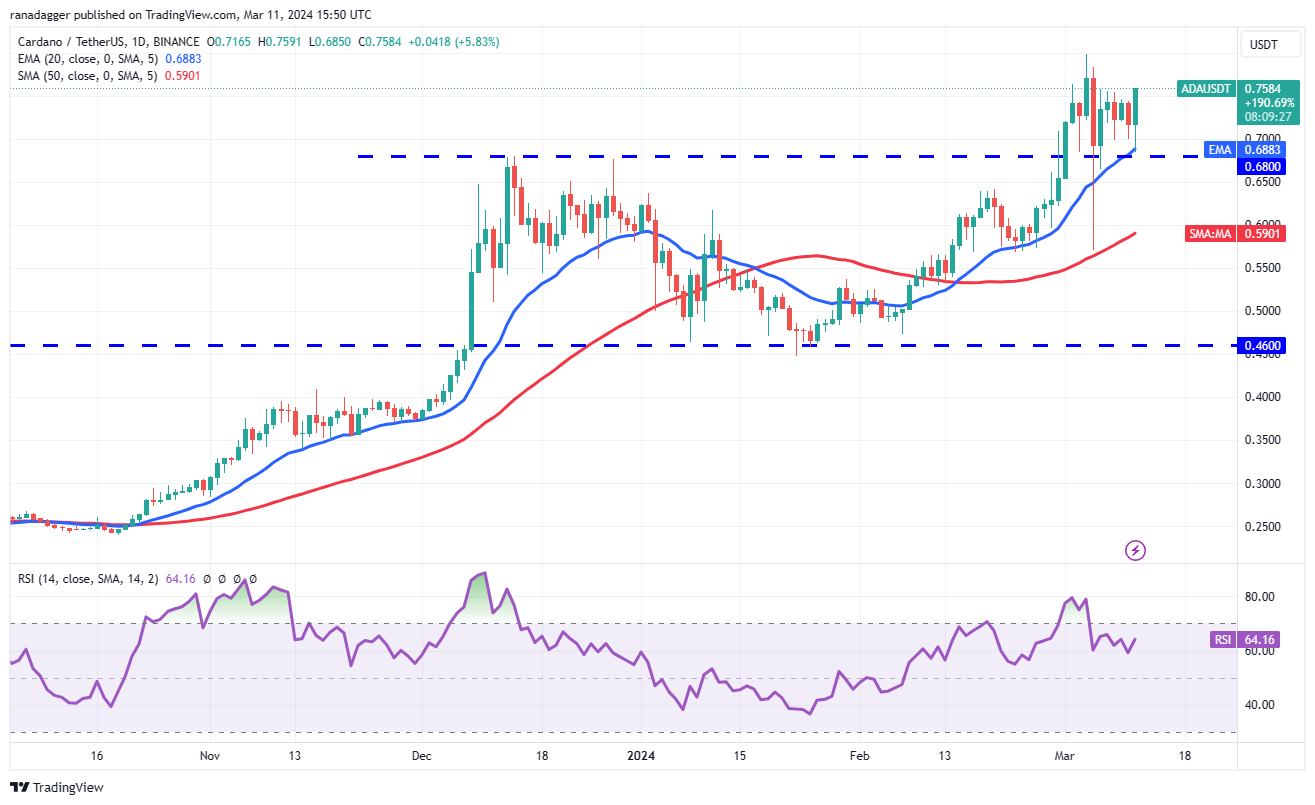
Cardano retreated to the $0.68 breakout level on March 11th, but the long wick on the candlestick indicates strong buying at lower levels. The rising 20-day EMA average of $0.68 and the RSI in the positive zone suggest that the path of least resistance is upwards.
Cardano는 3월 11일에 $0.68 돌파 수준으로 후퇴했지만, 캔들스틱의 긴 심지는 낮은 수준에서 강한 매수세를 나타냅니다. 20일 EMA 평균 $0.68 상승과 플러스 영역의 RSI는 저항이 가장 적은 경로가 위쪽임을 나타냅니다.
Buyers will try to lift the price to the March 4th high of $0.80. If this level is surpassed, the ADA/USDT pair could extend the rally to $0.90 and then to $1.25. This positive view will become invalid in the near term if the price falls and goes below $0.68. This would indicate a bearish reversal. The pair could then risk falling to the 50-day SMA average of $0.59.
구매자들은 가격을 3월 4일 최고치인 0.80달러까지 끌어올리려고 노력할 것입니다. 이 수준을 초과하면 ADA/USDT 쌍은 랠리를 $0.90, $1.25까지 확장할 수 있습니다. 가격이 $0.68 이하로 떨어지면 이러한 긍정적인 견해는 가까운 시일 내에 유효하지 않게 됩니다. 이는 약세 반전을 의미합니다. 그러면 해당 쌍은 50일 SMA 평균 $0.59까지 하락할 위험이 있습니다.
Dogecoin Chart Analysis
도지코인 차트 분석
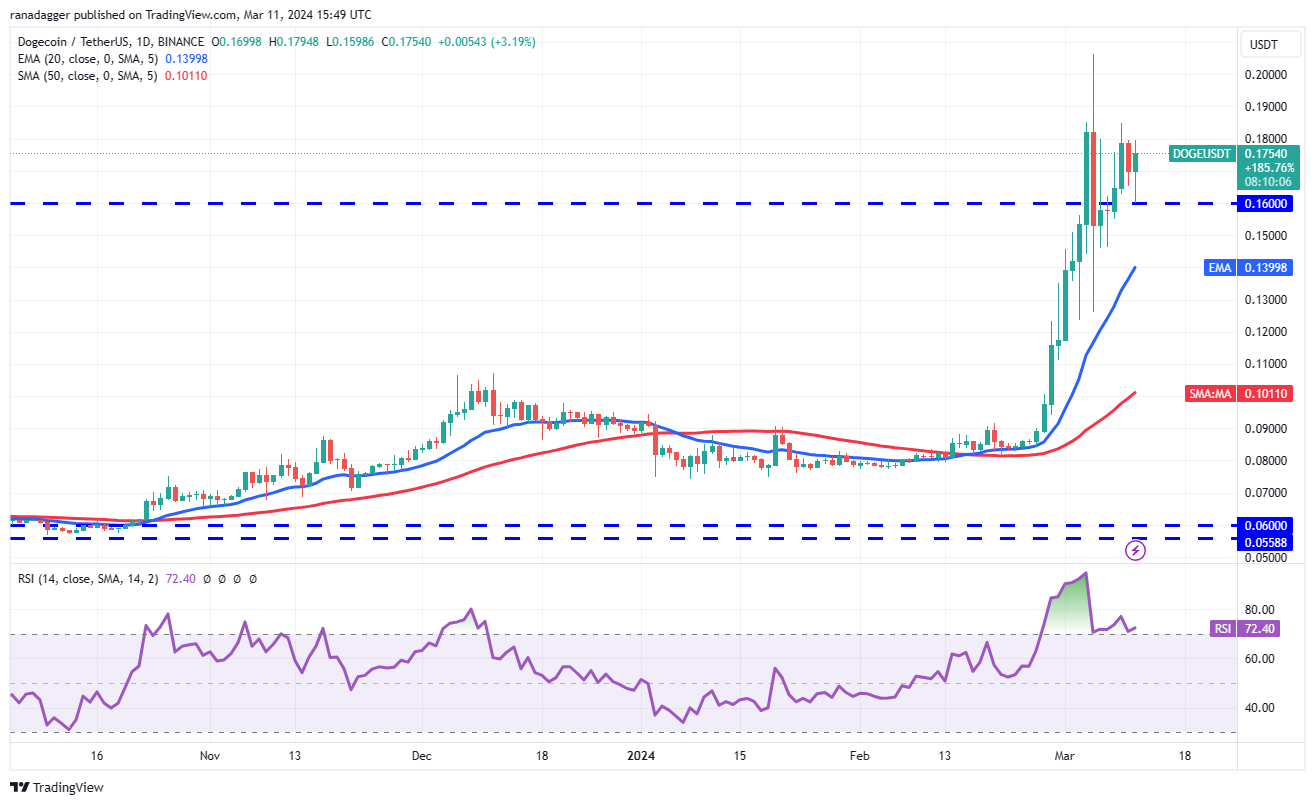
Bulls are fighting bears to keep Dogecoin above the $0.16 breakout level. The rising 20-day EMA average of $0.14 and the RSI in the overbought zone indicate that bulls have the upper hand. If buyers push and maintain the price above $0.18, the DOGE/USDT pair could retest $0.21 and then rise to $0.26.
Bulls는 Dogecoin을 $ 0.16 돌파 수준 이상으로 유지하기 위해 약세와 싸우고 있습니다. 20일 EMA 평균 $0.14 상승과 과매수 구간의 RSI는 상승세가 우위를 점하고 있음을 나타냅니다. 구매자가 가격을 $0.18 이상으로 유지하면 DOGE/USDT 쌍은 $0.21를 다시 테스트한 다음 $0.26으로 상승할 수 있습니다.
Conversely, if the price drops below $0.16, it will indicate that bulls have given up. The pair could fall to the 20-day EMA average, which remains a critical level to watch. A break below this support could initiate a deeper correction to $0.12.
반대로 가격이 0.16달러 아래로 떨어지면 황소가 포기했음을 나타냅니다. 이 쌍은 여전히 지켜봐야 할 중요한 수준인 20일 EMA 평균까지 떨어질 수 있습니다. 이 지지선을 밑돌면 $0.12까지 더 깊은 조정이 시작될 수 있습니다.
Shiba Inu Chart Analysis
시바견 차트 분석
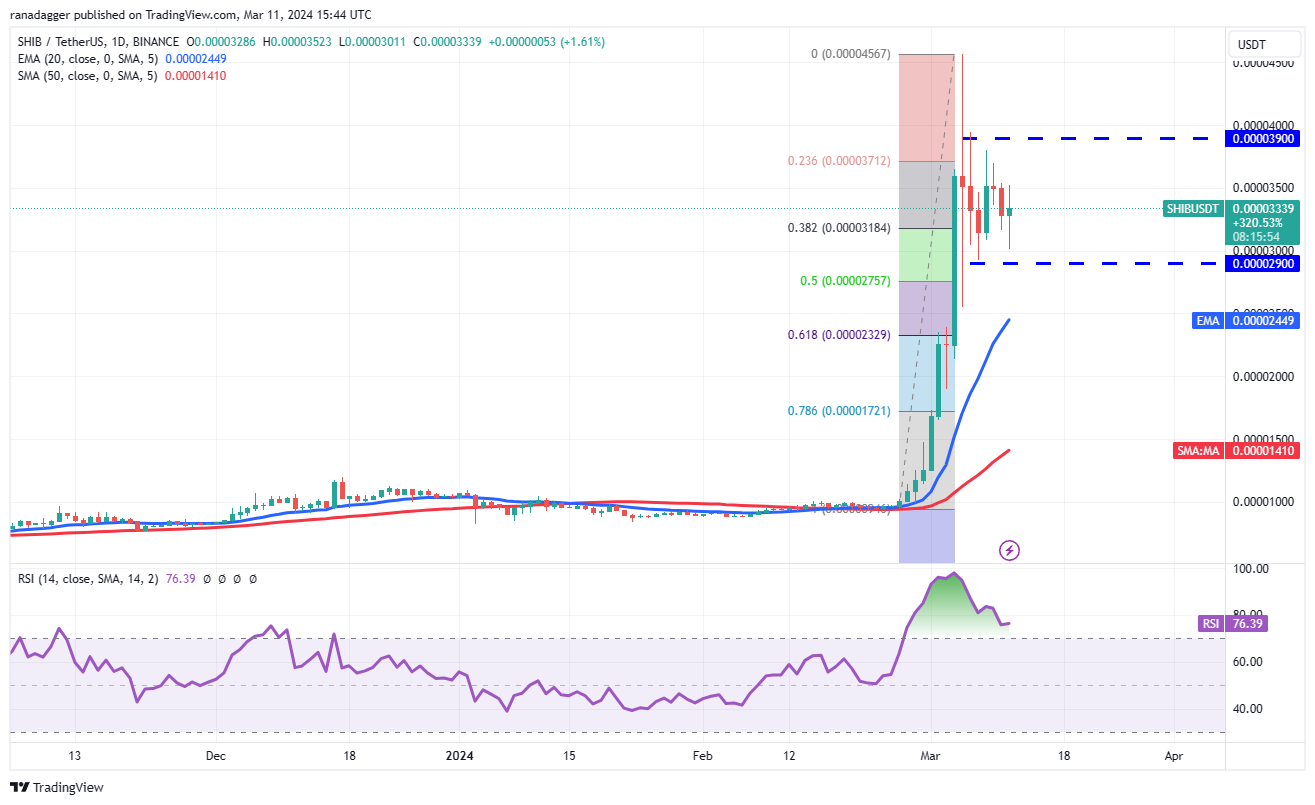
Shiba Inu is consolidating in a wide range between $0.000029 and $0.000039 after a sharp rally. The range-bound movement is correcting the overbought levels on the RSI and indicates that the bullish momentum is cooling off. The SHIB/USDT pair may continue to trade within this range for some time.
Shiba Inu는 급격한 랠리 이후 $0.000029에서 $0.000039 사이의 넓은 범위에서 통합되고 있습니다. 범위 제한 움직임은 RSI의 과매수 수준을 수정하고 강세 모멘텀이 냉각되고 있음을 나타냅니다. SHIB/USDT 쌍은 한동안 이 범위 내에서 계속 거래될 수 있습니다.
If the price falls below the range, the pair could drop to the very important level to watch, the 20-day EMA average. A break below this level would turn the advantage in favor of the bears. Conversely, a break above $0.000039 would signal that bulls are back in command. The pair could then rise to $0.000046. If this level is surpassed, the rally could reach $0.000065.
가격이 범위 아래로 떨어지면 쌍은 매우 중요한 수준인 20일 EMA 평균 수준으로 떨어질 수 있습니다. 이 수준 이하로 하락하면 하락세에게 유리한 방향으로 유리하게 바뀔 것입니다. 반대로 $0.000039를 넘어서면 강세장이 다시 주도권을 잡았다는 신호가 됩니다. 그러면 해당 쌍은 $0.000046까지 상승할 수 있습니다. 이 수준을 초과하면 랠리는 $0.000065에 도달할 수 있습니다.
The post first appeared on COINTURK NEWS: Insights on Cryptocurrency Market: Analysis of Altcoins and Their Potential Moves
해당 게시물은 COINTURK NEWS: 암호화폐 시장에 대한 통찰: 알트코인 분석 및 잠재적 움직임에 처음 게재되었습니다.
 DogeHome
 Thecryptoupdates
 The Bit Journal
 Times Tabloid
 CoinoMedia
 U_Today
 ETHNews
 crypto.news
 CoinPedia News


