You can also read this news on COINTURK NEWS: Insights on Cryptocurrency Market: Analysis of Altcoins and Their Potential Moves
このニュースは COINTURK NEWS でも読むことができます: 暗号通貨市場に関する洞察: アルトコインの分析とその潜在的な動き
In the cryptocurrency market, altcoin projects are gaining momentum under the leadership of Bitcoin. During this period, even though blockchain ecosystems and meme coin projects are somewhat overshadowed by artificial intelligence projects, they continue to please their investors. So, what is expected for SOL, ADA, DOGE, and SHIB in the coming period? We examine this with detailed chart analyses.
仮想通貨市場では、ビットコイン主導でアルトコインプロジェクトが勢いを増している。この期間中、ブロックチェーンエコシステムとミームコインプロジェクトは人工知能プロジェクトの影にやや影が薄くなっていますが、投資家を喜ばせ続けています。では、今後の SOL、ADA、DOGE、SHIB には何が期待されているのでしょうか?これを詳細なチャート分析で検証します。
Solana Chart Analysis
ソラナチャート分析
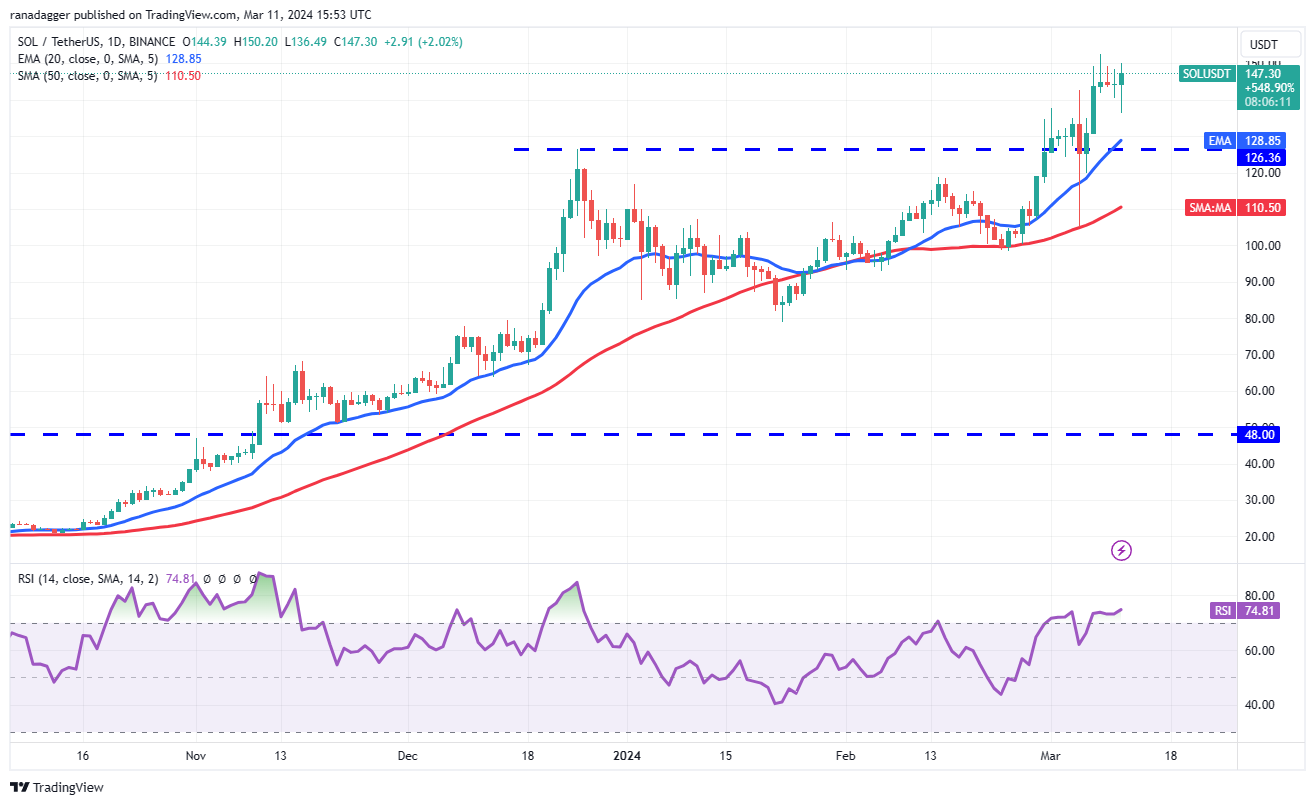
Bears are trying to initiate a correction in Solana, but the bulls have no intention of easing up. The shallow pullback once again indicates a lack of sellers. Buyers will try to take advantage of the situation and push the price above $153 to strengthen their positions. If they succeed, the SOL/USDT pair may continue its uptrend. The pair could then rise to $184.
弱気派はソラナ相場の調整を始めようとしているが、強気派には手を緩めるつもりはない。浅い反落は再び売り手が不足していることを示しています。買い手はこの状況を利用して、ポジションを強化するために価格を153ドル以上に押し上げようとするだろう。それが成功すれば、SOL/USDTペアは上昇傾向を続ける可能性があります。その後、ペアは184ドルまで上昇する可能性がある。
If bears want to block the upward movement, they need to quickly pull the price below the $126 breakout level. This could accelerate sales and open the doors for a drop to the 50-day SMA average of $110.
弱気派が上昇の動きを阻止したい場合は、価格をすぐに126ドルのブレイクアウトレベル以下に引き下げる必要がある。これにより売上が加速し、50日間のSMA平均である110ドルへの下落への扉が開く可能性がある。

Cardano Chart Analysis
Cardano チャート分析
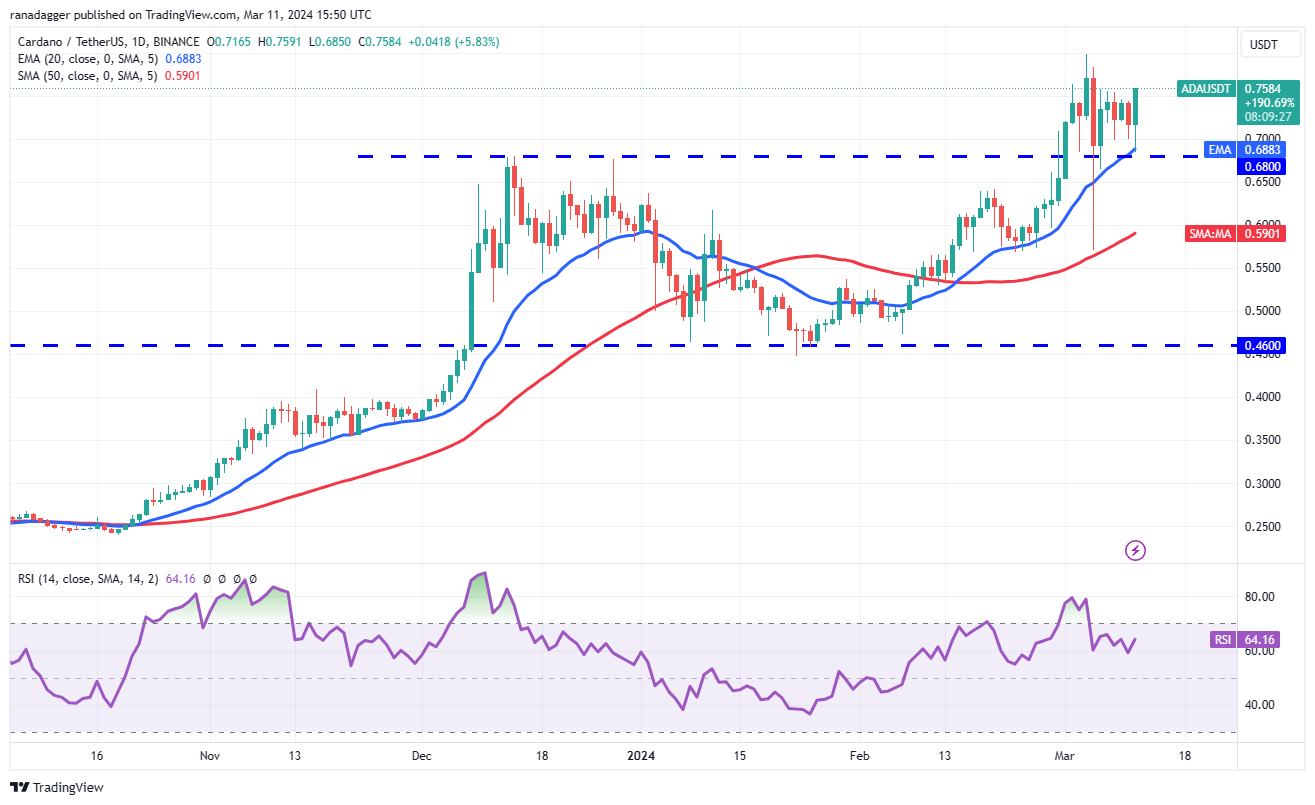
Cardano retreated to the $0.68 breakout level on March 11th, but the long wick on the candlestick indicates strong buying at lower levels. The rising 20-day EMA average of $0.68 and the RSI in the positive zone suggest that the path of least resistance is upwards.
カルダノは3月11日に0.68ドルのブレイクアウトレベルまで後退しましたが、ローソク足の長い芯は、より低いレベルでの強い買いを示しています。 20 日間 EMA 平均が 0.68 ドルと上昇しており、RSI がプラスゾーンにあることは、抵抗が最も少ない経路が上向きであることを示唆しています。
Buyers will try to lift the price to the March 4th high of $0.80. If this level is surpassed, the ADA/USDT pair could extend the rally to $0.90 and then to $1.25. This positive view will become invalid in the near term if the price falls and goes below $0.68. This would indicate a bearish reversal. The pair could then risk falling to the 50-day SMA average of $0.59.
買い手は価格を3月4日の高値である0.80ドルまで引き上げようとするだろう。このレベルを超えた場合、ADA/USDTペアは上昇を0.90ドル、さらに1.25ドルに拡大する可能性がある。価格が下落して0.68ドルを下回ると、この前向きな見方は短期的には無効になるだろう。これは弱気の反転を示すでしょう。そうなると、ペアは50日間のSMA平均である0.59ドルまで下落するリスクがある。

Dogecoin Chart Analysis
ドージコインチャート分析
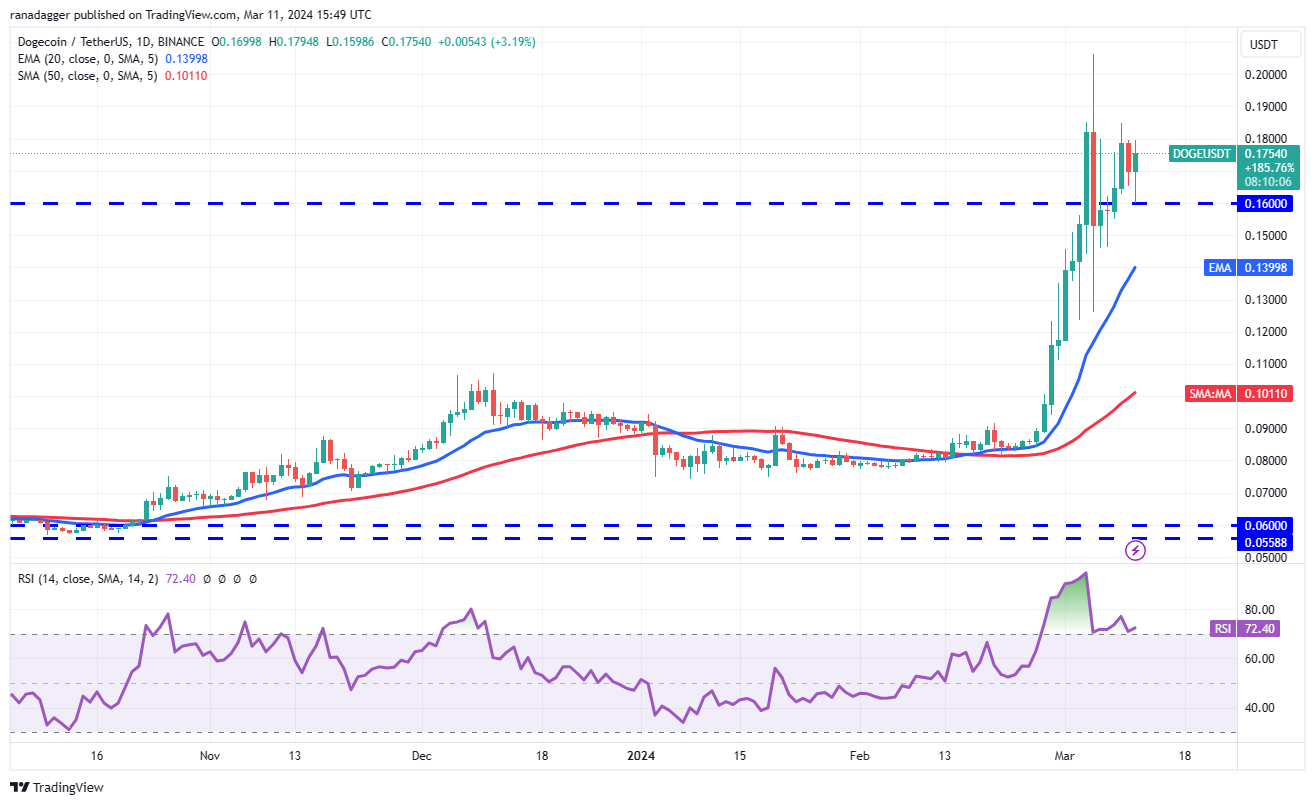
Bulls are fighting bears to keep Dogecoin above the $0.16 breakout level. The rising 20-day EMA average of $0.14 and the RSI in the overbought zone indicate that bulls have the upper hand. If buyers push and maintain the price above $0.18, the DOGE/USDT pair could retest $0.21 and then rise to $0.26.
強気派はドージコインを0.16ドルのブレイクアウトレベルを上回る水準に保つために弱気派と戦っている。 20日間EMA平均0.14ドルの上昇と買われ過ぎゾーンにあるRSIは強気派が優勢であることを示している。買い手が価格を0.18ドル以上に押し上げて維持した場合、DOGE/USDTペアは0.21ドルを再テストし、その後0.26ドルまで上昇する可能性がある。
Conversely, if the price drops below $0.16, it will indicate that bulls have given up. The pair could fall to the 20-day EMA average, which remains a critical level to watch. A break below this support could initiate a deeper correction to $0.12.
逆に、価格が0.16ドルを下回った場合は、強気派が諦めたことを示します。ペアは20日間EMA平均まで下落する可能性があり、これは依然として注目すべき重要なレベルである。このサポートを下回ると、0.12ドルまでのさらなる調整が始まる可能性がある。

Shiba Inu Chart Analysis
柴犬チャート分析
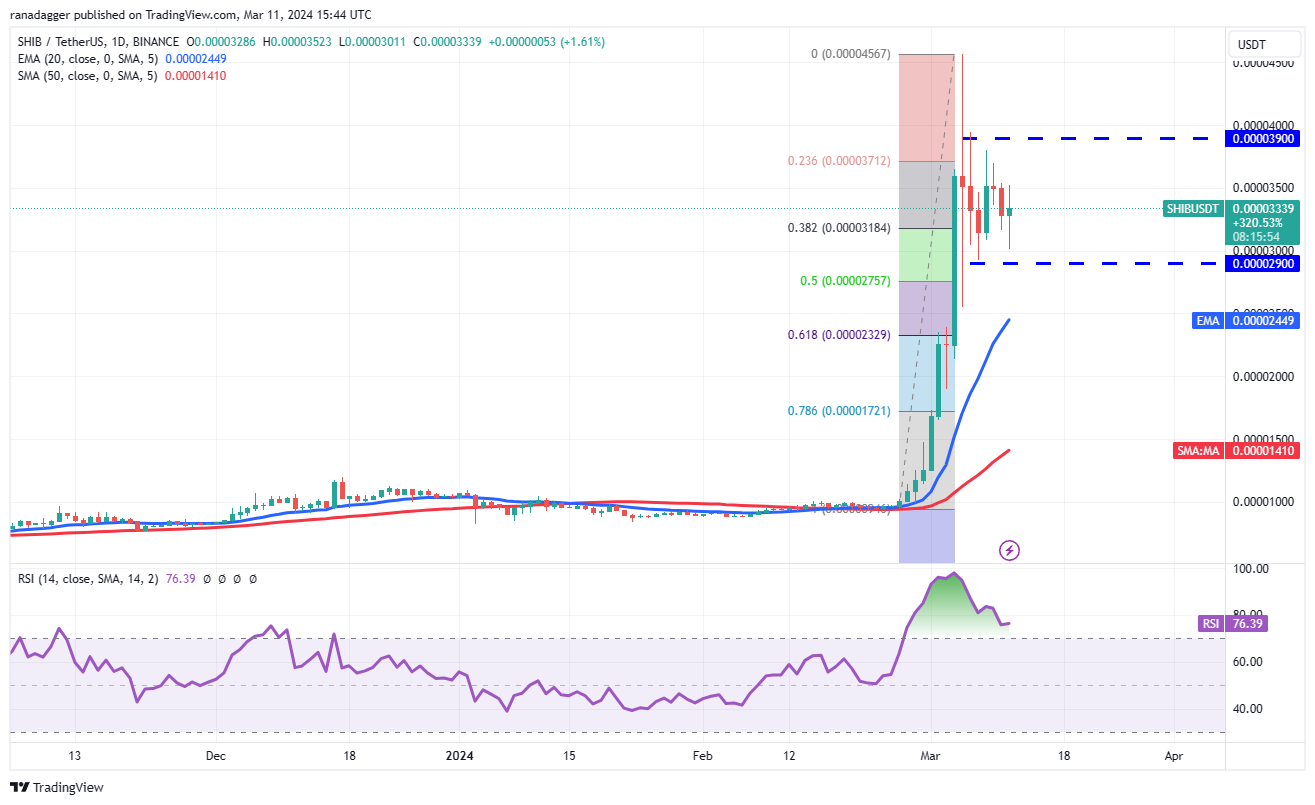
Shiba Inu is consolidating in a wide range between $0.000029 and $0.000039 after a sharp rally. The range-bound movement is correcting the overbought levels on the RSI and indicates that the bullish momentum is cooling off. The SHIB/USDT pair may continue to trade within this range for some time.
柴犬は急騰後、0.000029ドルから0.000039ドルまでの幅広いレンジで値固めを行っている。レンジ内での動きはRSIの買われ過ぎの水準を修正しており、強気の勢いが冷めつつあることを示している。 SHIB/USDTペアはしばらくの間、このレンジ内での取引が続く可能性がある。
If the price falls below the range, the pair could drop to the very important level to watch, the 20-day EMA average. A break below this level would turn the advantage in favor of the bears. Conversely, a break above $0.000039 would signal that bulls are back in command. The pair could then rise to $0.000046. If this level is surpassed, the rally could reach $0.000065.
価格がこの範囲を下回った場合、ペアは注目すべき非常に重要なレベルである20日間EMA平均まで下落する可能性があります。このレベルを下回ると、有利な状況は弱気派に有利になるだろう。逆に、0.000039ドルを超えると、強気派が再び主導権を握ったことを示すことになる。その後、ペアは0.000046ドルまで上昇する可能性があります。このレベルを超えた場合、ラリーは0.000065ドルに達する可能性があります。

The post first appeared on COINTURK NEWS: Insights on Cryptocurrency Market: Analysis of Altcoins and Their Potential Moves
この投稿は COINTURK NEWS に最初に掲載されました: 暗号通貨市場に関する洞察: アルトコインの分析とその潜在的な動き


 DogeHome
 Thecryptoupdates
 The Bit Journal
 Times Tabloid
 CoinoMedia
 U_Today
 ETHNews
 crypto.news
 CoinPedia News


