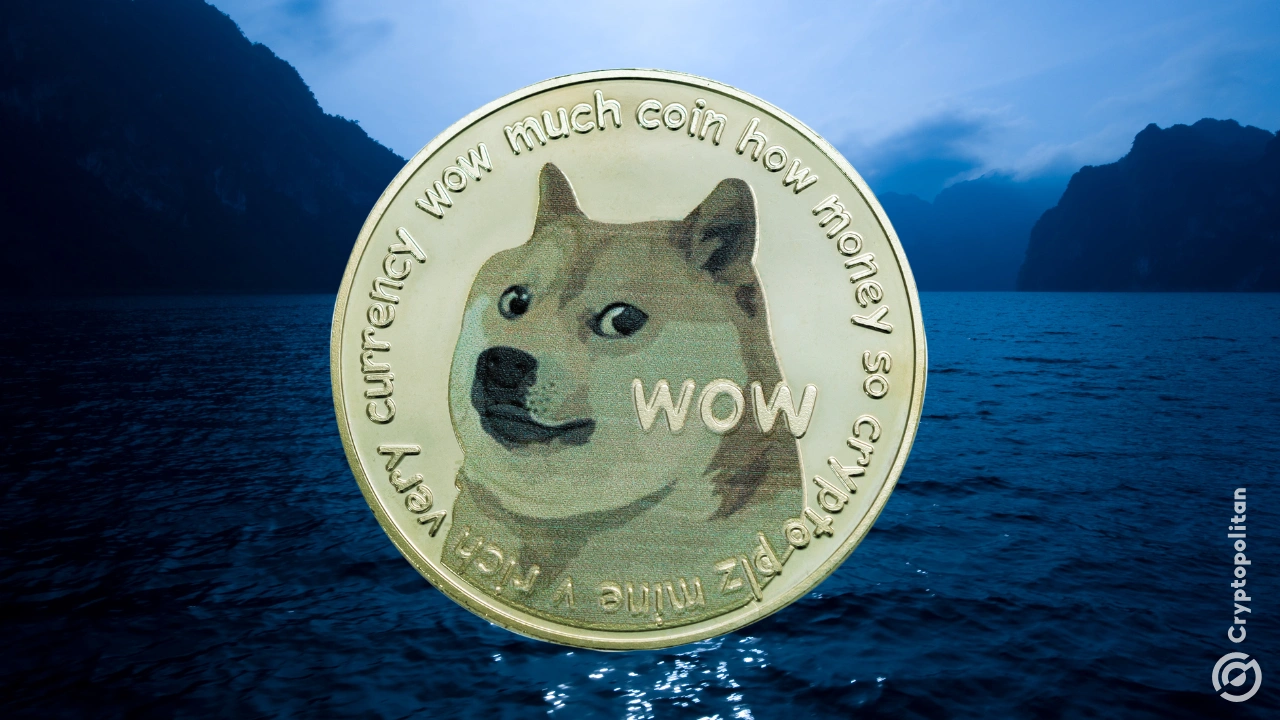
Dogecoin Takes a Dive After Strong Rally
Dogecoin은 강력한 랠리 이후 다이빙을 시작합니다
The cryptocurrency market is experiencing a widespread downturn, with Dogecoin (DOGE) being particularly affected after a surge in value. The meme cryptocurrency has lost approximately 22% of its worth in just 24 hours and over 27% in the past week.
암호화폐 시장은 광범위한 침체를 겪고 있으며, 특히 가치 급등 이후 Dogecoin(DOGE)이 영향을 받고 있습니다. 밈 암호화폐는 단 24시간 만에 가치의 약 22%를 잃었고 지난 주에는 27% 이상을 잃었습니다.
Market-Wide Correction
시장 전반의 수정
DOGE is not alone in this downward spiral. Bitcoin and other cryptocurrencies have also experienced significant declines, highlighting the volatility of the market. These shifts underscore the rapid fluctuations that can occur in the crypto space.
DOGE는 이러한 하향곡선에서 혼자가 아닙니다. 비트코인과 기타 암호화폐도 상당한 하락세를 보이며 시장의 변동성을 부각시켰습니다. 이러한 변화는 암호화폐 공간에서 발생할 수 있는 급격한 변동을 강조합니다.
Bullish Trend Gives Way to Correction
강세 추세가 조정으로 이어졌습니다.
The correction follows a period of strong gains for Dogecoin and the broader crypto market. The pullback has shifted sentiment, although seasoned traders recognize that such fluctuations are inherent to market cycles.
이번 조정은 Dogecoin과 더 넓은 암호화폐 시장이 크게 상승한 기간에 따른 것입니다. 노련한 거래자들은 그러한 변동이 시장 주기에 내재되어 있음을 인식하고 있지만 하락세로 인해 심리가 바뀌었습니다.
Dogecoin's Price Trajectory
Dogecoin의 가격 궤적
Dogecoin gained momentum in November, reaching a peak of around $0.503 in mid-December. However, it encountered resistance and has since entered a downtrend. Currently trading at $0.284, the price reflects a steep decline in line with the overall market sentiment.
Dogecoin은 11월에 추진력을 얻어 12월 중순에 약 $0.503의 최고점에 도달했습니다. 하지만 저항에 부딪혀 하락세에 진입했습니다. 현재 $0.284에 거래되고 있는 가격은 전반적인 시장 정서에 맞춰 급격한 하락세를 반영하고 있습니다.
Key Resistance and Support Levels
주요 저항 및 지원 수준
Key resistance levels for Dogecoin include $0.36652 (Fibonacci retracement) and $0.48431 (peak of the rally). On the downside, the immediate support zone stands at $0.26921. If breached, the price may drop further to $0.18649 or even revisit the August low of $0.08100.
Dogecoin의 주요 저항 수준에는 $0.36652(피보나치 되돌림) 및 $0.48431(반등 최고치)이 포함됩니다. 단점은 즉각적인 지원 영역이 $ 0.26921입니다. 이를 위반할 경우 가격은 $0.18649까지 더 떨어지거나 심지어 8월 최저치인 $0.08100까지 다시 방문할 수도 있습니다.
Technical Indicators Signal Bearish Sentiment
기술적 지표는 약세 심리를 나타냅니다.
Technical indicators reinforce the current bearish momentum. Bollinger Bands indicate that the price is below the lower band, signaling selling pressure. The RSI has also declined to 30.25, suggesting oversold conditions. While a short-term recovery is possible, oversold readings in downtrends tend to persist.
기술적 지표는 현재의 약세 모멘텀을 강화하고 있습니다. 볼린저 밴드는 가격이 하단 밴드 아래에 있음을 나타내며 매도 압력을 나타냅니다. RSI도 30.25로 하락해 과매도 상태를 시사했습니다. 단기적인 회복은 가능하지만 하락 추세에서 과매도 수치가 지속되는 경향이 있습니다.
Fibonacci Retracement Levels
피보나치 되돌림 수준
Fibonacci retracement levels mark potential reversal zones. The 0.618 level at $0.26921 is a critical test for buyers, while the 0.786 level at $0.18649 could provide subsequent support. Trading volumes have increased during the decline, emphasizing the ongoing bearish trend.
피보나치 되돌림 수준은 잠재적인 반전 영역을 나타냅니다. $0.26921의 0.618 수준은 구매자에게 중요한 테스트인 반면 $0.18649의 0.786 수준은 후속 지원을 제공할 수 있습니다. 하락세 동안 거래량이 증가해 지속적인 하락세를 강조했습니다.
Outlook for DOGE
DOGE에 대한 전망
Dogecoin continues to make lower highs and lows, indicating a bearish short-term trend. Persistent selling interest suggests a bearish outlook in the medium term. For any recovery, DOGE must stay above $0.26921 and overcome resistance at $0.36652. Failure to stabilize at current levels could lead to further declines.
Dogecoin은 계속해서 최고점과 최저점을 낮추고 있어 단기적인 약세 추세를 나타냅니다. 지속적인 매도 관심은 중기적으로 약세 전망을 시사합니다. 회복을 위해서는 DOGE가 $0.26921 이상을 유지하고 $0.36652의 저항을 극복해야 합니다. 현재 수준에서 안정되지 못하면 추가 하락이 발생할 수 있습니다.


 crypto.ro English
 Thecoinrepublic.com
 Crypto Daily™
 DogeHome
 U.Today
 Crypto Daily™
 Crypto Daily™
 Crypto News Land
 Cryptopolitan_News


