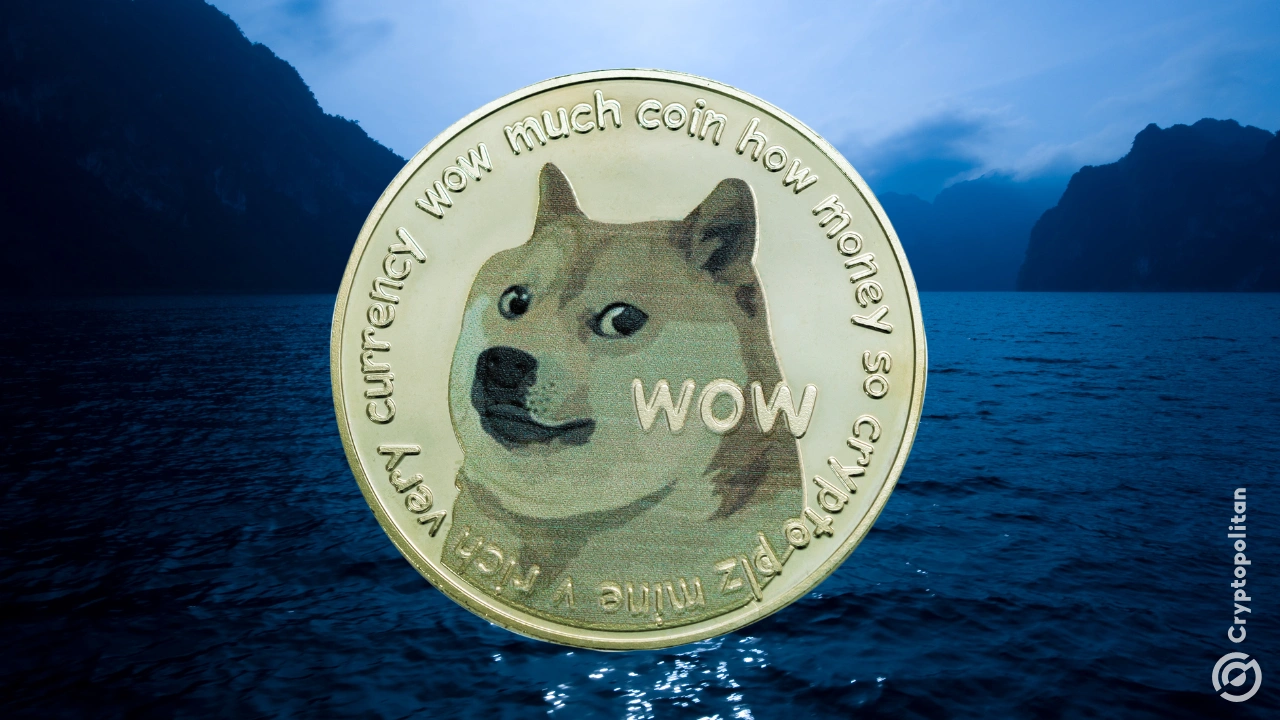
Dogecoin Takes a Dive After Strong Rally
ドージコイン、力強い上昇の後急落
The cryptocurrency market is experiencing a widespread downturn, with Dogecoin (DOGE) being particularly affected after a surge in value. The meme cryptocurrency has lost approximately 22% of its worth in just 24 hours and over 27% in the past week.
仮想通貨市場は広範な低迷に見舞われており、ドージコイン(DOGE)は価値の急騰後に特に影響を受けている。このミーム暗号通貨は、わずか 24 時間でその価値の約 22% を失い、過去 1 週間では 27% 以上を失いました。
Market-Wide Correction
市場全体の修正
DOGE is not alone in this downward spiral. Bitcoin and other cryptocurrencies have also experienced significant declines, highlighting the volatility of the market. These shifts underscore the rapid fluctuations that can occur in the crypto space.
この負のスパイラルに陥っているのは DOGE だけではありません。ビットコインやその他の仮想通貨も大幅な下落を経験し、市場のボラティリティを浮き彫りにしています。これらの変化は、暗号空間で起こり得る急速な変動を強調しています。
Bullish Trend Gives Way to Correction
強気傾向が修正へ
The correction follows a period of strong gains for Dogecoin and the broader crypto market. The pullback has shifted sentiment, although seasoned traders recognize that such fluctuations are inherent to market cycles.
この調整は、ドージコインとより広範な仮想通貨市場が大きく上昇した時期に続くものです。経験豊富なトレーダーは、こうした変動は市場サイクルに固有のものであることを認識しているが、反落によりセンチメントは変化した。
Dogecoin's Price Trajectory
ドージコインの価格推移
Dogecoin gained momentum in November, reaching a peak of around $0.503 in mid-December. However, it encountered resistance and has since entered a downtrend. Currently trading at $0.284, the price reflects a steep decline in line with the overall market sentiment.
ドージコインは11月に勢いを増し、12月中旬には約0.503ドルのピークに達した。しかし、抵抗に遭い、その後は下落トレンドに入った。現在0.284ドルで取引されており、この価格は市場全体のセンチメントに沿った大幅な下落を反映している。
Key Resistance and Support Levels
主要なレジスタンスとサポートのレベル
Key resistance levels for Dogecoin include $0.36652 (Fibonacci retracement) and $0.48431 (peak of the rally). On the downside, the immediate support zone stands at $0.26921. If breached, the price may drop further to $0.18649 or even revisit the August low of $0.08100.
ドージコインの主要な抵抗レベルには、0.36652ドル(フィボナッチリトレースメント)と0.48431ドル(上昇のピーク)が含まれます。下値としては、当面のサポートゾーンは0.26921ドルとなっている。これを突破した場合、価格はさらに0.18649ドルまで下落するか、8月の安値0.08100ドルを再び訪れる可能性がある。
Technical Indicators Signal Bearish Sentiment
弱気なセンチメントを示唆するテクニカル指標
Technical indicators reinforce the current bearish momentum. Bollinger Bands indicate that the price is below the lower band, signaling selling pressure. The RSI has also declined to 30.25, suggesting oversold conditions. While a short-term recovery is possible, oversold readings in downtrends tend to persist.
テクニカル指標は現在の弱気の勢いを強めています。ボリンジャーバンドは、価格が下限バンドを下回っていることを示し、売り圧力を示しています。 RSIも30.25まで低下しており、売られ過ぎの状況を示唆している。短期的な回復は可能ですが、下降トレンドにおける売られ過ぎの数値が続く傾向があります。
Fibonacci Retracement Levels
フィボナッチリトレースメントレベル
Fibonacci retracement levels mark potential reversal zones. The 0.618 level at $0.26921 is a critical test for buyers, while the 0.786 level at $0.18649 could provide subsequent support. Trading volumes have increased during the decline, emphasizing the ongoing bearish trend.
フィボナッチ リトレースメント レベルは、潜在的な反転ゾーンをマークします。 0.26921ドルの0.618レベルは買い手にとって重要なテストであり、0.18649ドルの0.786レベルはその後のサポートとなる可能性がある。取引高は下落中に増加し、継続的な弱気傾向を強調した。
Outlook for DOGE
DOGE の展望
Dogecoin continues to make lower highs and lows, indicating a bearish short-term trend. Persistent selling interest suggests a bearish outlook in the medium term. For any recovery, DOGE must stay above $0.26921 and overcome resistance at $0.36652. Failure to stabilize at current levels could lead to further declines.
ドージコインは引き続き高値と安値を切り下げており、短期的には弱気傾向を示しています。根強い売り気配は中期的には弱気の見通しを示唆している。回復するには、DOGEが0.26921ドルを超えて維持し、0.36652ドルの抵抗を克服する必要があります。現在の水準で安定できなければ、さらなる下落につながる可能性がある。


 Crypto Daily™
 DogeHome
 U.Today
 Crypto Daily™
 Crypto Daily™
 Crypto News Land
 Cryptopolitan_News
 TheNewsCrypto
 ItsBitcoinWorld


