Pepe ($PEPE) Ascending Triangle Signals Bullish Breakout
Pepe ($PEPE) 상승 삼각형 신호 강세 돌파
Pepe ($PEPE) has formed an ascending triangle pattern, indicating a potential bullish breakout. The key resistance level at $0.0000126000 stands as an obstacle to the upside.
Pepe($PEPE)는 상승 삼각형 패턴을 형성하여 강세 돌파 가능성을 나타냅니다. $0.0000126000의 주요 저항 수준은 상승을 가로막는 장애물입니다.
Support and Momentum Indicators
지지 및 모멘텀 지표
Key support levels at $0.0000120000 and the ascending trendline support the upward momentum of $PEPE. The RSI indicator at 59.40 and the MACD crossing above the signal line suggest a favorable bullish trend.
$0.0000120000의 주요 지지 수준과 상승 추세선은 $PEPE의 상승 모멘텀을 뒷받침합니다. 59.40의 RSI 지표와 신호선 위를 교차하는 MACD는 유리한 강세 추세를 시사합니다.
Analyst's Observation
분석가의 관찰
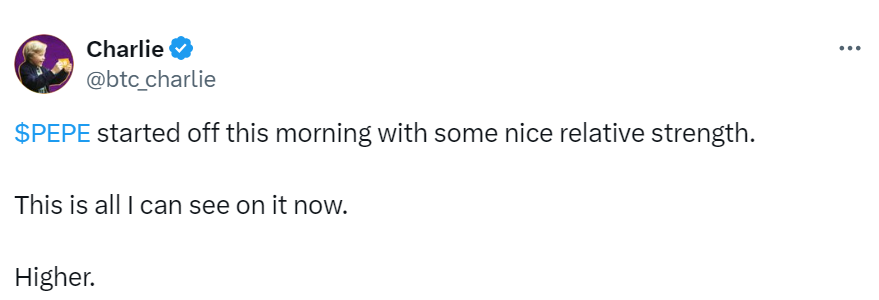
Analyst Charlie has noted that Pepe ($PEPE) has shown significant relative strength in recent trading sessions. A 15-minute timeframe analysis reveals critical support and resistance levels.
분석가 Charlie는 Pepe($PEPE)가 최근 거래 세션에서 상당한 상대적 강세를 보였다고 지적했습니다. 15분 기간 분석을 통해 중요한 지지 및 저항 수준이 드러납니다.
Key Support Levels
주요 지원 수준
The ascending trendline support provides a strong foundation for Pepe's ($PEPE) uptrend. This line has consistently served as a bounce point for the price action. Additionally, the horizontal support at $0.0000120000 has witnessed multiple price rebounds.
상승 추세선 지지는 Pepe($PEPE) 상승 추세에 대한 강력한 기반을 제공합니다. 이 선은 지속적으로 가격 조치의 바운스 포인트 역할을 해왔습니다. 또한 $0.0000120000의 수평적 지지는 여러 번의 가격 반등을 목격했습니다.
Additional Information
추가 정보
For further insights into Pepe ($PEPE)'s price trend and potential future movements, refer to the following resources:
Pepe($PEPE)의 가격 추세 및 잠재적 미래 움직임에 대한 추가 통찰력을 얻으려면 다음 리소스를 참조하십시오.

- Website
- Telegram
웹사이트트위터텔레그램인스타그램


 crypto.ro English
 Thecoinrepublic.com
 Crypto Daily™
 DogeHome
 U.Today
 Crypto Daily™
 Crypto Daily™
 Crypto News Land
 Cryptopolitan_News


