Pepe ($PEPE) Ascending Triangle Signals Bullish Breakout
Pepe ($PEPE) has formed an ascending triangle pattern, indicating a potential bullish breakout. The key resistance level at $0.0000126000 stands as an obstacle to the upside.
Support and Momentum Indicators
Key support levels at $0.0000120000 and the ascending trendline support the upward momentum of $PEPE. The RSI indicator at 59.40 and the MACD crossing above the signal line suggest a favorable bullish trend.
Analyst's Observation
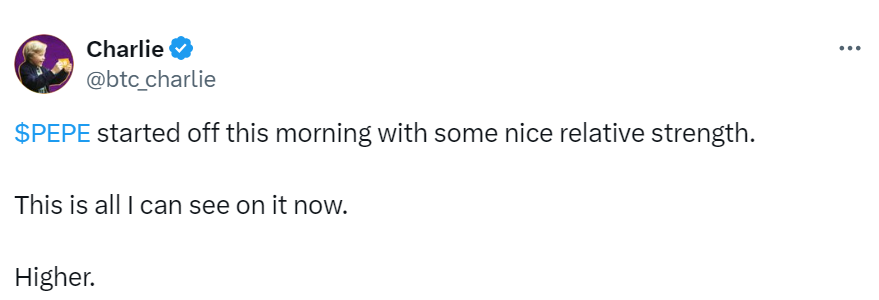
Analyst Charlie has noted that Pepe ($PEPE) has shown significant relative strength in recent trading sessions. A 15-minute timeframe analysis reveals critical support and resistance levels.
Key Support Levels
The ascending trendline support provides a strong foundation for Pepe's ($PEPE) uptrend. This line has consistently served as a bounce point for the price action. Additionally, the horizontal support at $0.0000120000 has witnessed multiple price rebounds.
Additional Information
For further insights into Pepe ($PEPE)'s price trend and potential future movements, refer to the following resources:

- Website
- Telegram


 Thecoinrepublic.com
 crypto.ro English
 Crypto Daily™
 DogeHome
 U.Today
 Crypto Daily™
 Crypto Daily™
 Crypto News Land
 Cryptopolitan_News


