Bitcoin Eyes Support Hold, Altcoins Face Pressure
Bitcoin Eyes 지원 보류, Altcoins 얼굴 압력
Bitcoin (BTC) has dipped below $90,000, facing resistance from bears eager to shift control. However, historical data reveals a January dip after halving years, presenting potential buying opportunities. In 2017 and 2021, BTC experienced declines of 30% and 25%, respectively, but rebounded and reached record highs later in the year.
비트코인(BTC)은 통제권을 바꾸려는 약세자들의 저항에 직면하면서 90,000달러 아래로 떨어졌습니다. 그러나 과거 데이터를 보면 반년이 지난 후 1월의 하락세를 보여 잠재적인 매수 기회를 제시하고 있습니다. 2017년과 2021년 BTC는 각각 30%와 25%의 하락세를 겪었지만, 올해 말 반등해 사상 최고치를 기록했습니다.
The broader financial markets are also experiencing turbulence, with the S&P 500 (SPX) undergoing a correction. The strength of the US Dollar Index (DXY) is pressuring risk assets, while markets anticipate less aggressive rate cuts in the future.
S&P 500(SPX)이 조정을 거치는 등 광범위한 금융시장도 혼란을 겪고 있습니다. 미국 달러 지수(DXY)의 강점은 위험 자산을 압박하고 있는 반면, 시장은 향후 덜 공격적인 금리 인하를 예상하고 있습니다.
Despite short-term uncertainty, long-term investors continue to accumulate Bitcoin. MicroStrategy has recently acquired 2,530 BTC, boosting its holdings to 450,000.
단기적인 불확실성에도 불구하고 장기 투자자들은 비트코인을 계속해서 축적하고 있습니다. MicroStrategy는 최근 2,530 BTC를 인수하여 보유량을 450,000으로 늘렸습니다.
Technical Analysis
기술적 분석
S&P 500 Index
S&P 500 지수
SPX has formed a head-and-shoulders pattern, with a breakdown below 5,853. Bulls aim to recover the level, while bears seek to defend it. A drop below 5,853 could trigger a fall to 5,670, while a break above 5,929 (20-day EMA) could invalidate the breakdown.
SPX는 5,853 미만으로 하락하면서 머리-어깨 패턴을 형성했습니다. 황소는 수준을 회복하는 것을 목표로 하고 곰은 수준을 방어하려고 합니다. 5,853 아래로 떨어지면 5,670까지 하락할 수 있고, 5,929(20일 EMA)를 넘어서면 하락세가 무효화될 수 있습니다.
US Dollar Index
미국 달러 지수
DXY has bounced off its 20-day EMA, indicating positive sentiment and support for the uptrend. Bulls have pushed the index above 109.53. Further rallies are possible towards 111.27 and 113.14, while a drop below 108 could signal a reversal.
DXY는 20일 EMA에서 반등하여 상승 추세에 대한 긍정적인 감정과 지지를 나타냅니다. 상승세는 지수를 109.53 위로 밀어냈습니다. 111.27과 113.14를 향한 추가 랠리가 가능하며, 108 아래로 떨어지면 반전 신호를 보낼 수 있습니다.
Bitcoin
비트코인
BTC has turned down from its 20-day EMA, facing selling pressure. A dip below $90,000 could lead to a potential drop to $85,000 or $73,777. Bulls are trying to hold the $90,000 level, but a sustained breakdown could extend the decline.
BTC는 매도 압력에 직면해 20일 EMA를 거부했습니다. $90,000 아래로 떨어지면 잠재적으로 $85,000 또는 $73,777까지 하락할 수 있습니다. 강세론자들은 90,000달러 수준을 유지하려고 노력하고 있지만 지속적인 붕괴로 인해 하락폭이 확대될 수 있습니다.
Ether
에테르
ETH has broken down below the head-and-shoulders neckline, indicating bearish dominance. A decline to $2,850 is likely, with support expected there. A rally from $2,850 could face resistance at the neckline, increasing the risk of a drop below $2,850. A break above the neckline could signal a bullish reversal.
ETH는 헤드앤숄더 네크라인 아래로 무너져 약세 지배력을 나타냅니다. $2,850까지 하락할 가능성이 높으며 그곳에서 지원이 예상됩니다. 2,850달러에서 출발하는 랠리는 네크라인에서 저항에 직면해 2,850달러 아래로 하락할 위험이 높아집니다. 네크라인을 돌파하면 강세 반전을 나타낼 수 있습니다.
XRP
XRP
XRP has broken out of a symmetrical triangle pattern, showing bullish potential. Support lies at $2.35 (20-day EMA), while a rise above the triangle could lead to gains towards $2.60, $2.73, and $2.91. A break below the moving averages could result in a dip to the support line.
XRP는 대칭 삼각형 패턴을 벗어나 강세 잠재력을 보여줍니다. 지지선은 2.35달러(20일 EMA)이며, 삼각형 위로 상승하면 2.60달러, 2.73달러, 2.91달러까지 상승할 수 있습니다. 이동평균선을 하향 돌파할 경우 지지선이 하락할 수 있습니다.
BNB
BNB
BNB has failed to reclaim $697 (20-day EMA), indicating a sell-off at higher levels. Bears aim to push the pair towards the uptrend line, with a breach below this support potentially leading to a decline to $635. A recovery from the uptrend line would signal ongoing bullish sentiment.
BNB는 697달러(20일 EMA)를 회수하지 못해 더 높은 수준의 매도세를 나타냅니다. 하락세는 이 쌍을 상승 추세선으로 끌어올리는 것을 목표로 하며, 이 지지선을 밑돌면 $635까지 하락할 가능성이 있습니다. 상승 추세선에서 회복된다면 강세 심리가 지속되고 있다는 신호가 될 것입니다.
Solana
솔라나
SOL has fallen below its uptrend line, suggesting bearish momentum. A close below the line could trigger a decline to $155, where bulls are expected to defend the level. A drop below $133 could indicate further bearish pressure. A break above $196 (20-day EMA) would indicate strength.
SOL은 상승 추세선 아래로 하락하여 약세 모멘텀을 시사하고 있습니다. 선 아래로 종가가 형성되면 $155까지 하락할 수 있으며, 이 선에서 황소가 방어할 것으로 예상됩니다. $133 아래로 하락하면 추가 약세 압력을 나타낼 수 있습니다. $196(20일 EMA)를 넘는 돌파는 강세를 나타냅니다.
Dogecoin
도지코인
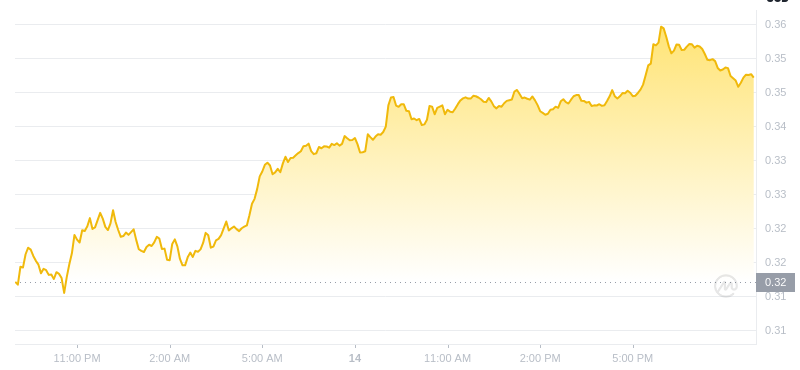
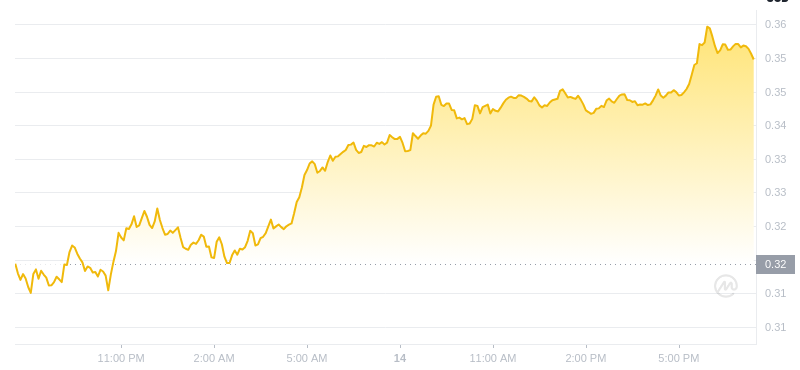
DOGE has declined from its 20-day EMA, with strong support at $0.30. A breach of this level could lead to a drop to $0.27. A rebound from $0.30 would suggest bullish buying, while a break above the 20-day EMA could signal a potential trading range between $0.30 and $0.40.
DOGE는 20일 EMA에서 $0.30의 강력한 지지를 받으며 하락했습니다. 이 수준을 위반하면 $0.27까지 하락할 수 있습니다. $0.30에서 반등하는 것은 강세 매수를 시사하는 반면, 20일 EMA를 넘어서는 것은 $0.30에서 $0.40 사이의 잠재적 거래 범위를 신호할 수 있습니다.
Cardano
카르다노
ADA has failed to recover from the uptrend line, facing negative sentiment. Bulls will attempt to defend the line and push the pair above $1.01 (50-day SMA), while bears aim to break below the line and target $0.80 or $0.76. A breakout above the triangle would indicate bullish control.
ADA는 부정적인 정서에 직면하면서 상승 추세선에서 회복하지 못했습니다. 황소는 선을 방어하고 $1.01(50일 SMA) 이상으로 상승을 시도하는 반면, 하락세는 선을 하향 이탈하여 $0.80 또는 $0.76을 목표로 합니다. 삼각형 위의 돌파는 강세 통제를 나타냅니다.
Avalanche
눈사태
AVAX has broken below $34.87, indicating bearish dominance. Support exists at $33.60, but a drop below could lead to a decline to $30.50 or $22.35. Bulls face resistance at $38.67 (20-day EMA) and $45. A break above $45 would signal a potential end to the correction.
AVAX는 $34.87 아래로 떨어졌으며 이는 약세 지배력을 나타냅니다. 지지선은 $33.60이지만 아래로 떨어지면 $30.50 또는 $22.35까지 하락할 수 있습니다. 황소는 $38.67(20일 EMA)와 $45의 저항에 직면해 있습니다. $45를 넘는 돌파는 조정이 끝날 가능성이 있다는 신호입니다.
Disclaimer: This article is for informational purposes only and should not be considered investment advice or recommendations.
면책 조항: 이 기사는 정보 제공 목적으로만 작성되었으며 투자 조언이나 추천으로 간주되어서는 안 됩니다.


 CFN
CFN DogeHome
 Optimisus
 CoinPedia News
 Bitcoin Sistemi EN
 CoinPedia News
 Bitcoin Sistemi EN
 crypto.news
 DogeHome


