

Bitcoin's (BTC) recovery is facing resistance at higher price points, suggesting persistent bearish pressure. Material Indicators reported on X that a significant trader, referred to as "Spoofy the Whale," has been suppressing the price below $87,500.
비트 코인 (BTC) 회복은 더 높은 가격대에서 저항에 직면하여 지속적인 약세 압력을 시사합니다. 자재 지표는 X에 "Spoofy the Whale"이라고하는 중요한 상인이 87,500 달러 이하로 가격을 억제하고 있다고보고했습니다.
While upward movement is currently constrained, some analysts believe the downside is limited. BitMEX co-founder Arthur Hayes suggested on X that Bitcoin may have bottomed out around $77,000, citing the Federal Reserve's announced slowdown in quantitative tightening starting in April.
상향 운동은 현재 제한되어 있지만 일부 분석가들은 단점이 제한되어 있다고 생각합니다. Bitmex의 공동 창립자 인 Arthur Hayes는 X에 비트 코인이 약 77,000 달러 정도 떨어져 있다고 제안했으며, 4 월부터 미연방 준비 제도의 정량 조임 속도가 저조한 것을 인용하면서.
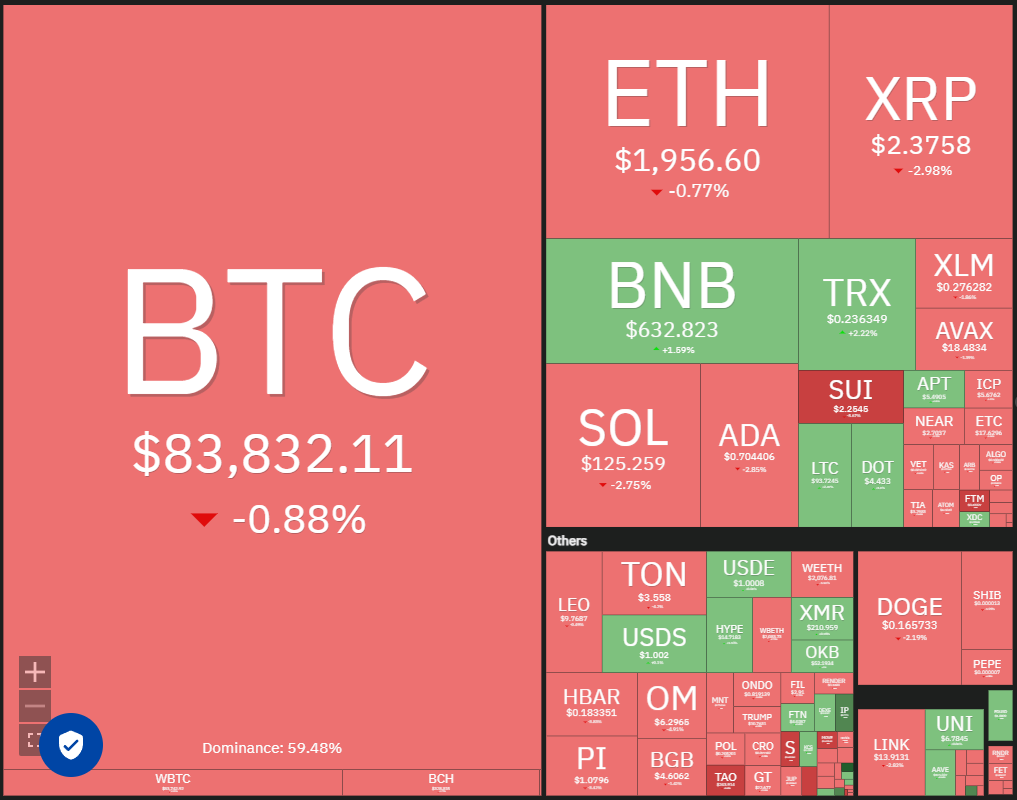
Another potential bullish factor is the possibility of a recession, according to Robbie Mitchnick, head of digital assets at BlackRock. In a Yahoo Finance interview, Mitchnick stated that BlackRock's long-term Bitcoin investors are unfazed by current economic challenges and view the market downturn as a buying opportunity.
BlackRock의 디지털 자산 책임자 인 Robbie Mitchnick에 따르면 또 다른 잠재적 인 낙관적 요인은 경기 침체의 가능성이라고한다. Yahoo Finance 인터뷰에서 Mitchnick은 Blackrock의 장기 비트 코인 투자자들이 현재의 경제 문제에 익으며 시장 침체를 구매 기회로보고 있다고 말했습니다.
Could Bitcoin establish a higher low and break above $87,500 in the near future? And would that spark increased buying in altcoins? Let's examine the charts of the top 10 cryptocurrencies.
비트 코인은 가까운 시일 내에 더 높은 낮은 낮은 수준을 설정하고 $ 87,500 이상을 깨뜨릴 수 있습니까? 그리고 그 불꽃이 Altcoins의 구매를 증가시킬까요? 상위 10 개의 cryptocurrencies의 차트를 살펴 보겠습니다.
Bitcoin Price Analysis
비트 코인 가격 분석
Bitcoin briefly surpassed its 20-day exponential moving average ($85,332) on March 19th, but this relief rally was halted by bearish pressure at the resistance level.
비트 코인은 3 월 19 일에 20 일 지수 이동 평균 (85,332 달러)을 능가했지만이 구호 집회는 저항 수준에서 약세의 압력으로 중단되었습니다.
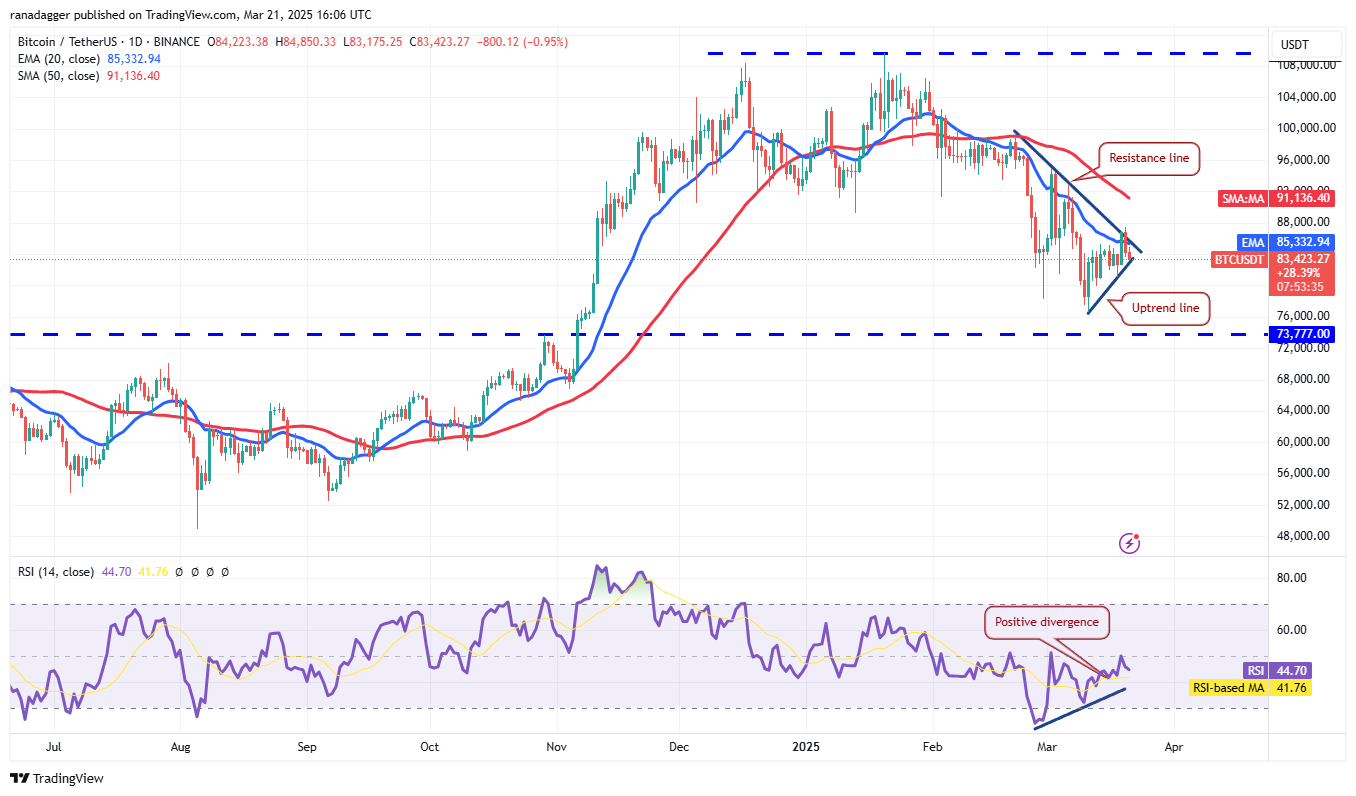
A break below the uptrend line could send BTC/USDT down to $80,000 and potentially further to $76,606. The $76,606 to $73,777 zone is anticipated to attract strong buying, but continued bearish dominance could lead to a decline to $67,000.
Uptrend 라인 아래의 휴식은 BTC/USDT를 $ 80,000로, 잠재적으로 76,606 달러로 보낼 수 있습니다. $ 76,606 ~ $ 73,777 구역은 강력한 구매를 유치 할 것으로 예상되지만, 지속적인 약세 지배력은 67,000 달러로 감소 할 수 있습니다.
Conversely, a rebound off the uptrend line and a break above $87,500 could trigger a significant upward movement. While the 50-day simple moving average ($91,136) might provide resistance, a break above it could propel the price towards $95,000 and potentially $100,000.
반대로, 상승 라인에서 리바운드와 87,500 달러 이상의 휴식은 상당한 상승 운동을 유발할 수 있습니다. 50 일 간단한 이동 평균 ($ 91,136)은 저항을 제공 할 수 있지만, 그 이상의 휴식은 가격을 95,000 달러, 잠재적으로 10 만 달러로 추진할 수 있습니다.
Ether Price Analysis
에테르 가격 분석
Ether's (ETH) recovery stalled at the 20-day EMA ($2,067), indicating continued bearish activity at higher levels.
에테르의 (ETH) 회복은 20 일 EMA ($ 2,067)에서 정체되어 더 높은 수준에서 지속적인 약세 활동을 나타냅니다.

A drop below $1,927 could push ETH/USDT towards $1,800. Support is expected around $1,750 to $1,800, but a break below this range could trigger a decline to $1,550.
$ 1,927 미만의 하락은 ETH/USDT를 $ 1,800으로 밀어 넣을 수 있습니다. 지원은 약 $ 1,750에서 $ 1,800 정도 예상되지만이 범위 아래의 휴식은 $ 1,550로 감소 할 수 있습니다.
This bearish outlook would be invalidated if the price rises above the breakdown level of $2,111, potentially leading to a rally towards the 50-day SMA ($2,420) and eventually $2,850.
가격이 2,111 달러의 고장 수준보다 높아지면이 약세 전망은 무효화되어 잠재적으로 50 일 SMA ($ 2,420)와 결국 2,850 달러를 향한 집회로 이어질 것입니다.
XRP Price Analysis
XRP 가격 분석
XRP (XRP) briefly surpassed its moving averages on March 19th, but this momentum proved unsustainable.
XRP (XRP)는 3 월 19 일에 이동 평균을 잠시 능가했지만이 모멘텀은 지속 불가능한 것으로 판명되었습니다.
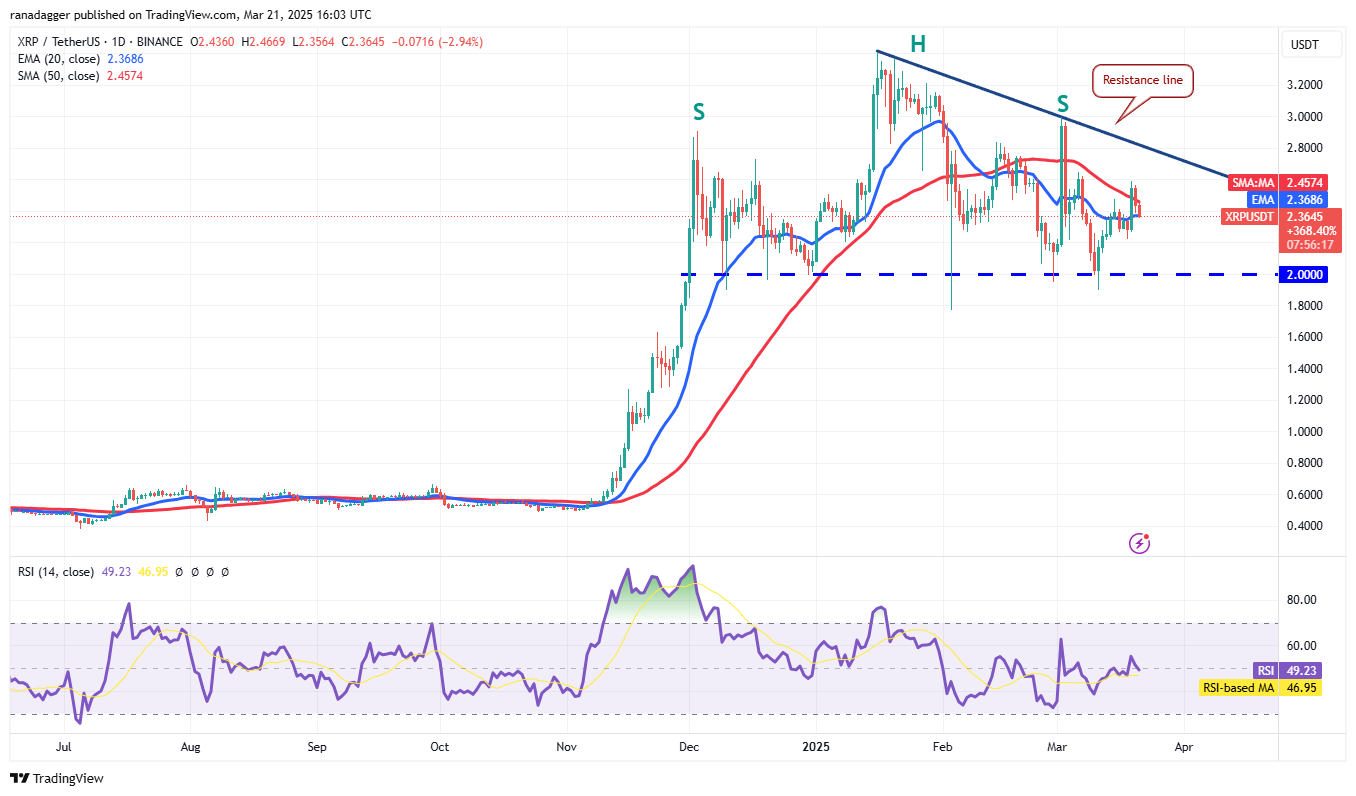
Bearish pressure is attempting to push the price below the 20-day EMA ($2.36). Success could lead to a decline to $2.22 and then to the crucial support at $2. A break below $2 could complete a bearish head-and-shoulders pattern.
약세의 압력은 20 일 EMA ($ 2.36) 아래로 가격을 추진하려고합니다. 성공은 $ 2.22로 감소한 다음 2 달러의 결정적인 지원으로 이어질 수 있습니다. $ 2 미만의 휴식은 약세와 어깨 패턴을 완성 할 수 있습니다.
Conversely, a rebound off the 20-day EMA would signal buying interest, potentially leading to a rise towards the resistance line.
반대로, 20 일의 EMA의 반등은 구매 지분을 알리고 잠재적으로 저항 라인을 향해 증가 할 것입니다.
BNB Price Analysis
BNB 가격 분석
BNB's (BNB) pullback found support at the 20-day EMA ($608) on March 19th, indicating buying on dips.
BNB (BNB)의 풀백은 3 월 19 일 20 일 EMA ($ 608)에서 지원을 받았으며 딥 구매를 나타냅니다.
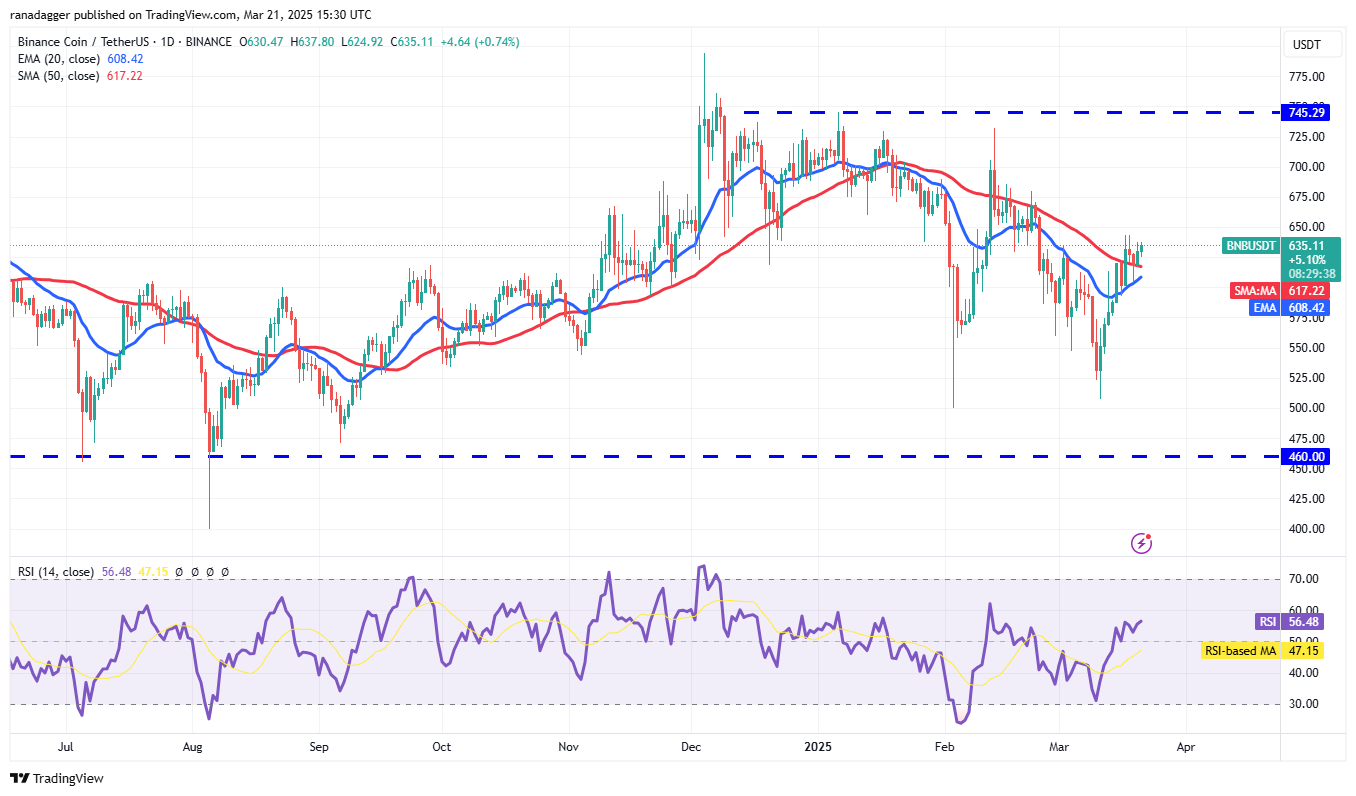
The 20-day EMA is turning upwards, and the RSI is positive, suggesting a slight buyer advantage. A break above $644 could lead to a rally to $686. Resistance is expected around $686, with a break above potentially pushing the price to $745.
20 일의 EMA가 위로 올라가고 RSI는 양수이어서 약간의 구매자 이점을 나타냅니다. 644 달러 이상의 휴식은 랠리로 이어질 수 있습니다. 저항은 약 686 달러에 예상되며, 그 이상의 휴식은 잠재적으로 가격을 745 달러로 추진할 수 있습니다.
A break below the 20-day EMA would favor sellers, potentially leading to a decline to $550.
20 일 이하의 EMA 이하의 휴식은 판매자를 선호하여 잠재적으로 $ 550로 감소 할 것입니다.
Solana Price Analysis
Solana 가격 분석
Solana (SOL) reversed from the 20-day EMA ($135) on March 20th, suggesting continued selling on minor rallies.
Solana (Sol)는 3 월 20 일 20 일 EMA ($ 135)에서 역전하여 경미한 집회에 대한 지속적인 판매를 제안했습니다.
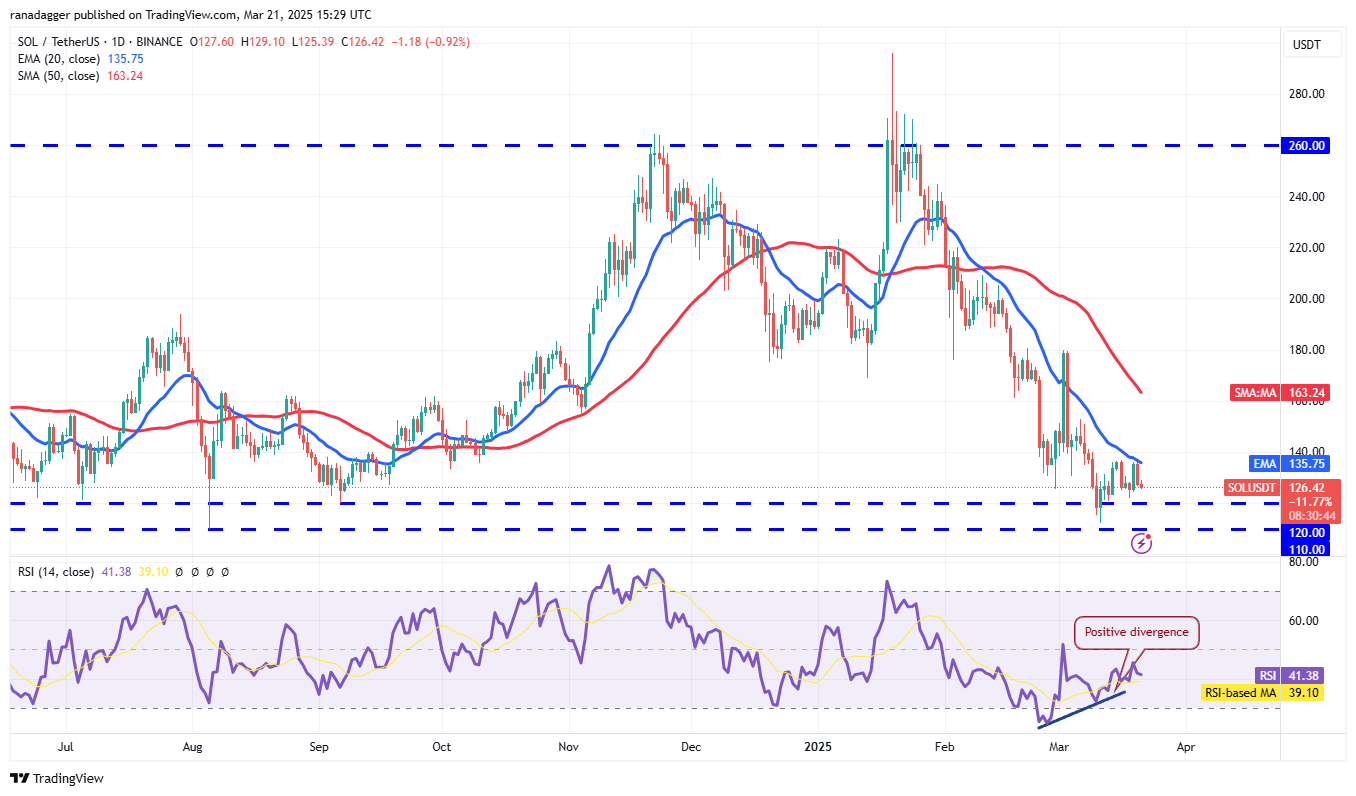
SOL/USDT could fall to $120 and then to $110. Strong support is expected around $110. A rebound from this level could lead to another attempt to break above the 20-day EMA, potentially reaching the 50-day SMA ($163).
Sol/USDT는 $ 120로 떨어지고 $ 110로 떨어질 수 있습니다. 강력한 지원은 약 $ 110 정도입니다. 이 수준의 반등은 20 일 EMA를 넘어서서 잠재적으로 50 일 SMA에 도달하려는 또 다른 시도로 이어질 수 있습니다 ($ 163).
However, a break below $110 would likely resume the downtrend, potentially leading to a decline to $98 and then $80.
그러나 110 달러 이하의 휴식은 하락세를 재개하여 잠재적으로 $ 98, 80 달러로 감소 할 것입니다.
Cardano Price Analysis
Cardano 가격 분석
Cardano (ADA) reversed from its moving averages on March 20th, indicating bearish defense of the current level.
Cardano (ADA)는 3 월 20 일 이동 평균에서 역전되어 현재 수준의 약세 방어를 나타냅니다.
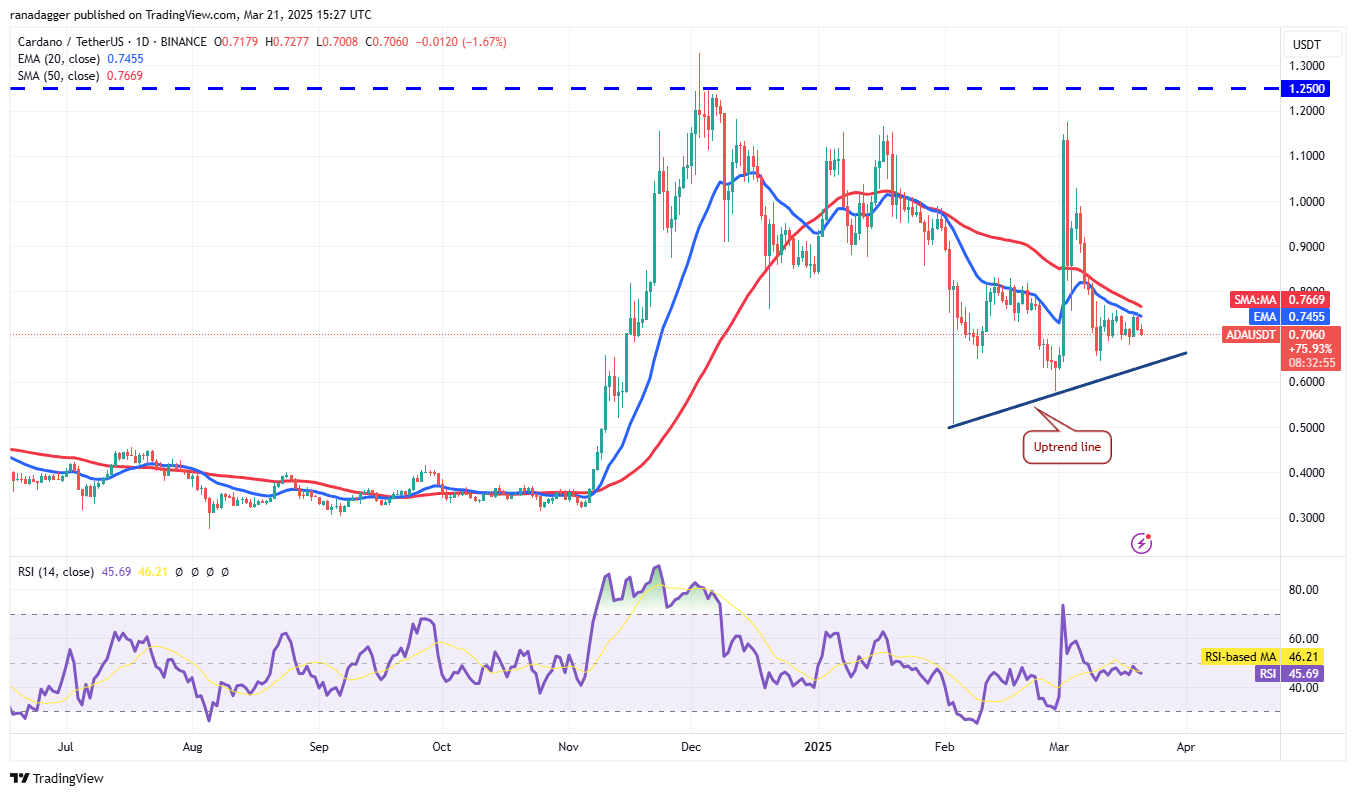
Sellers will likely target the uptrend line, where buying is expected. A strong rebound from the uptrend line could lead to a break above the moving averages and a rally to $1.02.
판매자는 구매가 예상되는 상승 라인을 목표로 할 것입니다. 상향 트렌드 라인에서 강한 반등은 이동 평균보다 중단되고 랠리는 $ 1.02로 이어질 수 있습니다.
Conversely, a break below the uptrend line would suggest a shift to bearish dominance, potentially leading to a decline towards $0.58 and then $0.50, where strong buying is anticipated.
반대로, 상승 라인 아래의 휴식은 약세의 지배로의 전환을 시사 할 것이며, 잠재적으로 $ 0.58로 감소한 다음 0.50 달러로 강력한 구매가 예상됩니다.
Dogecoin Price Analysis
Dogecoin 가격 분석
Buyers are struggling to push Dogecoin (DOGE) above the 20-day EMA ($0.18), reflecting negative sentiment.
구매자는 Dogecoin (Doge)을 20 일 EMA ($ 0.18) 이상으로 밀어 내고 부정적인 감정을 반영하기 위해 고군분투하고 있습니다.
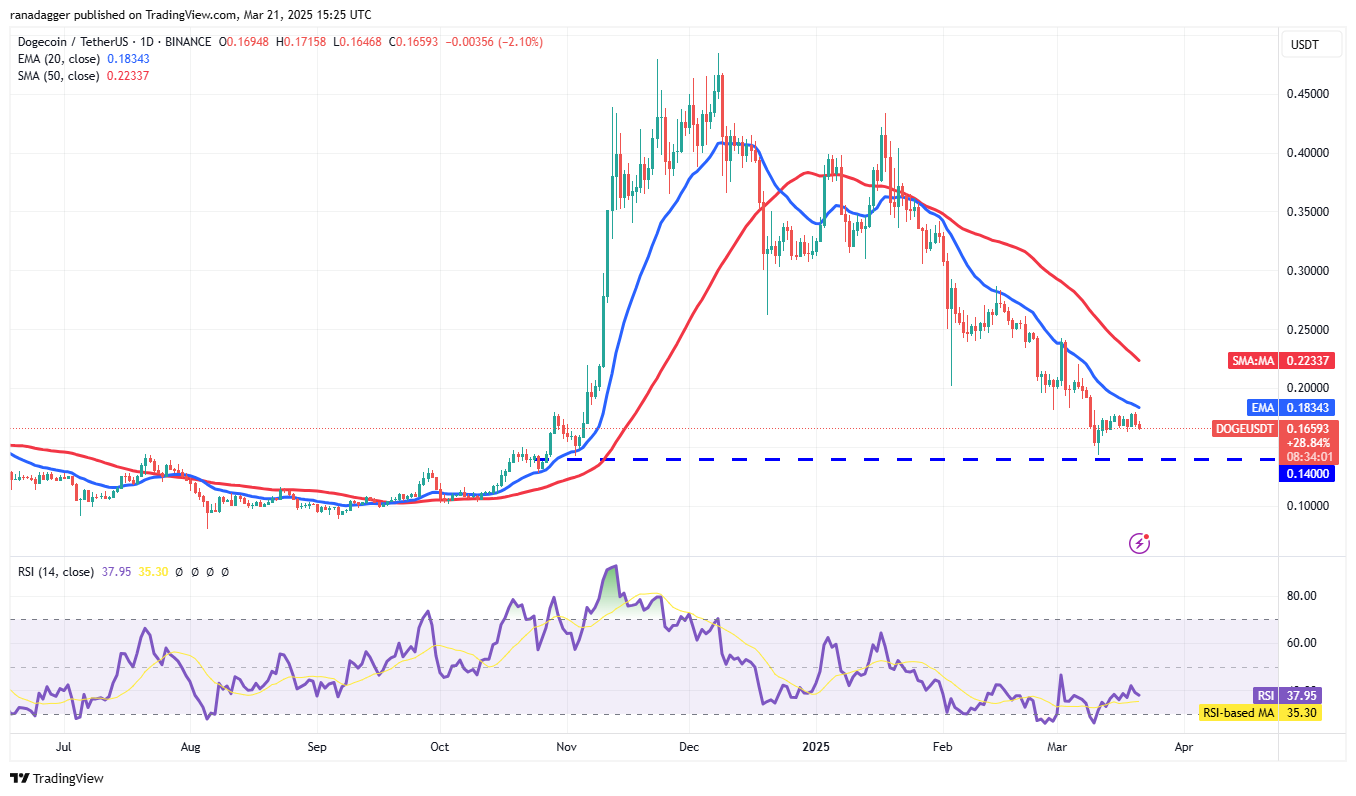
A fall below $0.16 could retest the crucial support at $0.14. This is a key level for bulls to defend; a break below could lead to a decline to $0.10.
$ 0.16 미만의 하락은 $ 0.14로 중요한 지원을 재개 할 수 있습니다. 이것은 황소가 방어하는 핵심 수준입니다. 아래의 휴식은 $ 0.10으로 감소 할 수 있습니다.
Conversely, a break above the 20-day EMA would signal renewed buying interest, potentially leading to a rise towards the 50-day SMA ($0.22) and then to $0.29.
반대로, 20 일의 EMA를 넘어서는 중단은 갱신 된 구매이자를 알릴 것이며, 잠재적으로 50 일 SMA ($ 0.22)로 상승한 다음 $ 0.29로 이어질 것입니다.
Toncoin Price Analysis
Toncoin 가격 분석
Toncoin (TON) surpassed the 50-day SMA ($3.51) on March 19th, but bears are attempting to halt the upward momentum at $4.
Toncoin (Ton)은 3 월 19 일에 50 일 SMA ($ 3.51)를 능가했지만 곰은 4 달러로 상승 운동량을 중단하려고 시도하고 있습니다.
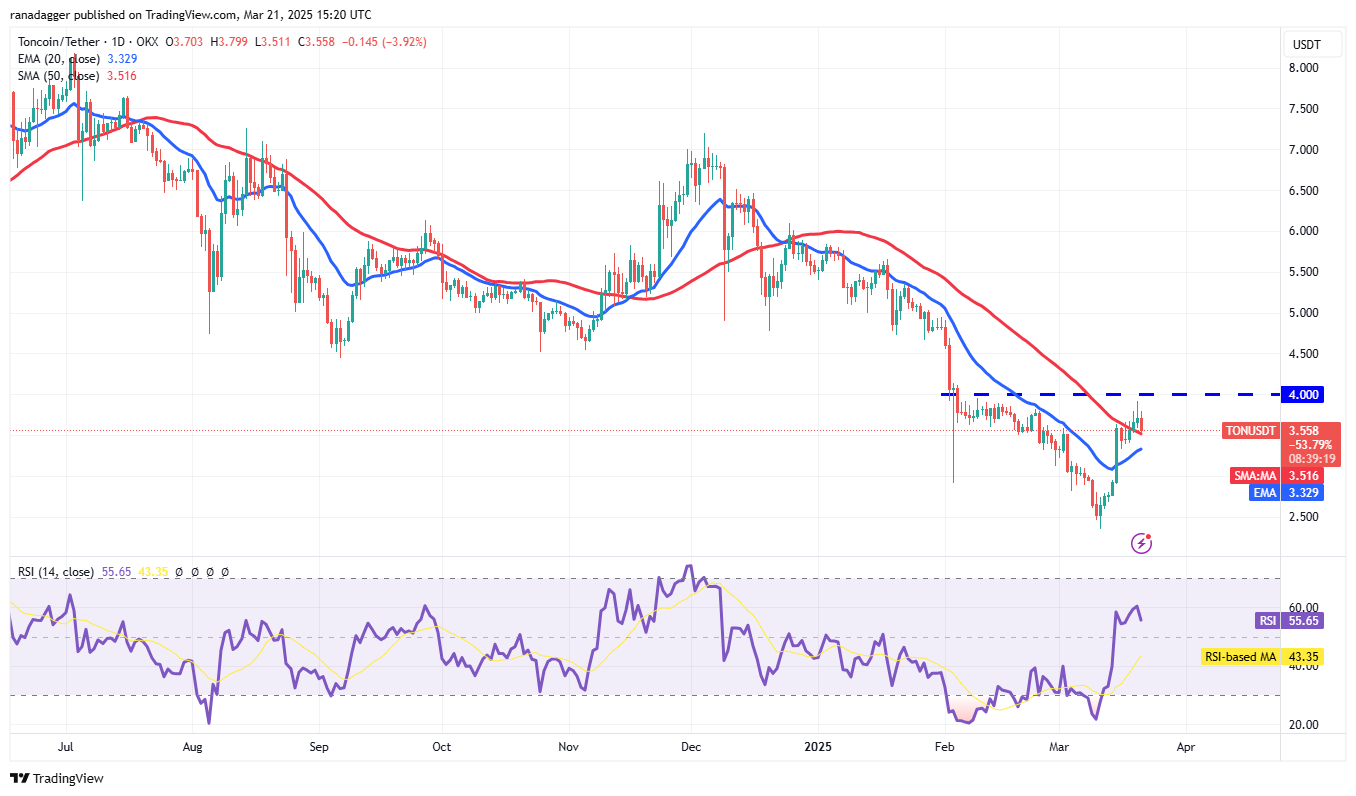
The 20-day EMA ($3.32) is turning upwards, and the RSI is positive, favoring buyers. Support is expected at the 20-day EMA, which could facilitate a break above $4, potentially leading to a rise to $5 and then $5.50.
20 일 EMA ($ 3.32)가 위로 올라가고 RSI는 긍정적이며 구매자에게 유리합니다. 20 일 EMA에서 지원은 $ 4 이상의 휴식을 촉진하여 잠재적으로 $ 5로 상승한 다음 5.50 달러로 증가 할 수 있습니다.
Sellers would need to push the price below the 20-day EMA to regain control, potentially leading to a decline to $3.
판매자는 20 일 동안 EMA 이하의 가격을 추진하여 통제권을 되찾아 잠재적으로 3 달러로 감소해야합니다.
Chainlink Price Analysis
체인 링크 가격 분석
Chainlink (LINK) rose above the 20-day EMA ($14.59) on March 19th, but this was short-lived.
체인 링크 (링크)는 3 월 19 일에 20 일 EMA ($ 14.59) 이상으로 상승했지만 수명이 짧았습니다.
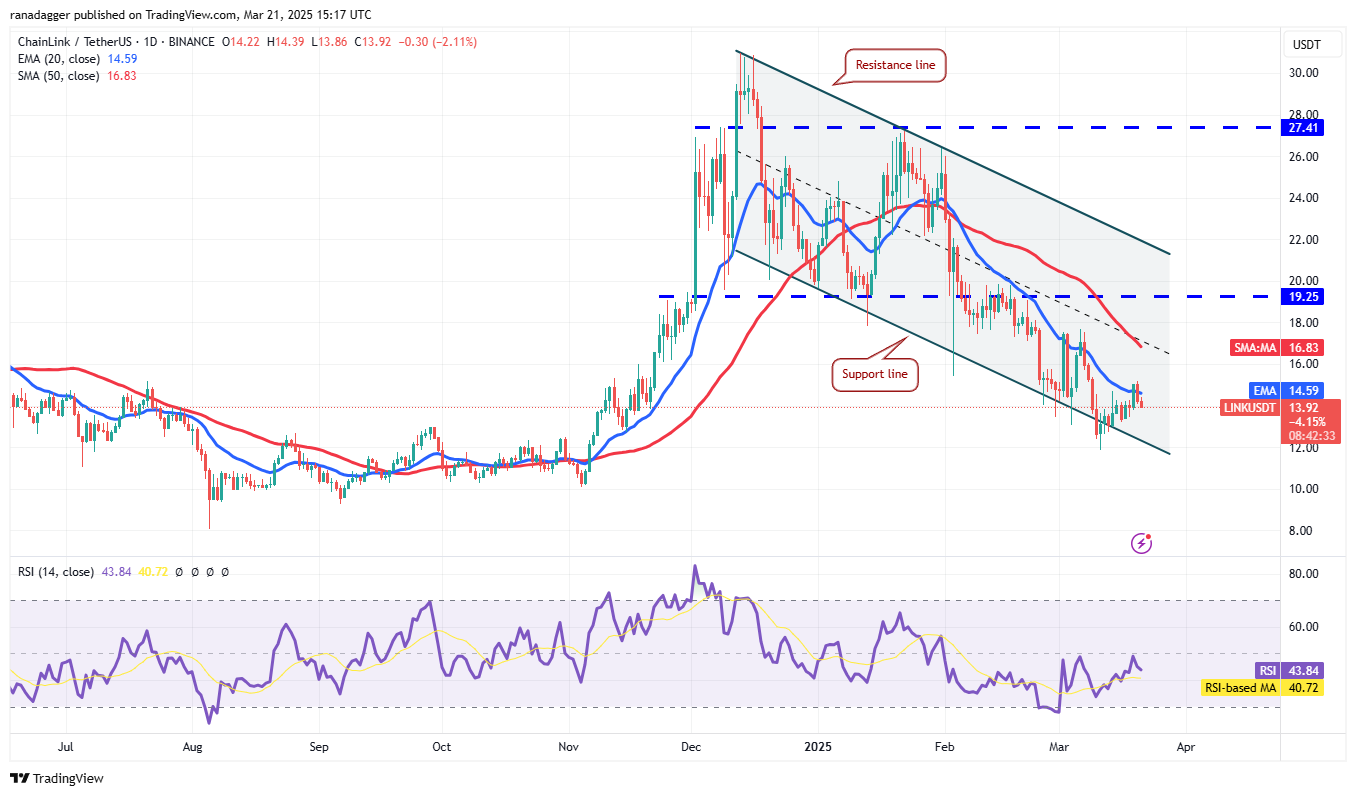
The price fell below the 20-day EMA on March 20th, signaling selling at higher levels. Bears will likely target the crucial support at $12.
가격은 3 월 20 일 20 일 EMA보다 낮아졌으며, 더 높은 수준에서 판매를 신호 전환했습니다. Bears는 12 달러에 중요한 지원을 목표로 할 것입니다.
A rebound from the current level or $12 would indicate a shift from selling on rallies to buying on dips, potentially leading to a renewed attempt to reach the 50-day SMA ($16.83) and then $19.25.
현재 수준 또는 12 달러에서 반등하면 랠리 판매에서 딥 구매로의 전환이 발생하여 잠재적으로 50 일 SMA ($ 16.83)에 도달하려는 새로운 시도로 이어질 수 있습니다.
A continued decline below $12 would likely lead to a drop towards the psychological support level of $10.
12 달러 미만의 지속적인 감소는 심리적 지원 수준으로 $ 10로 떨어질 것입니다.
UNUS SED LEO Price Analysis
하나의 사자 가격 분석
UNUS SED LEO (LEO) remains below the resistance at $10, indicating persistent bearish pressure.
Unus Sed Leo (LEO)는 $ 10에서 저항 아래로 유지되며, 지속적인 약세 압력을 나타냅니다.
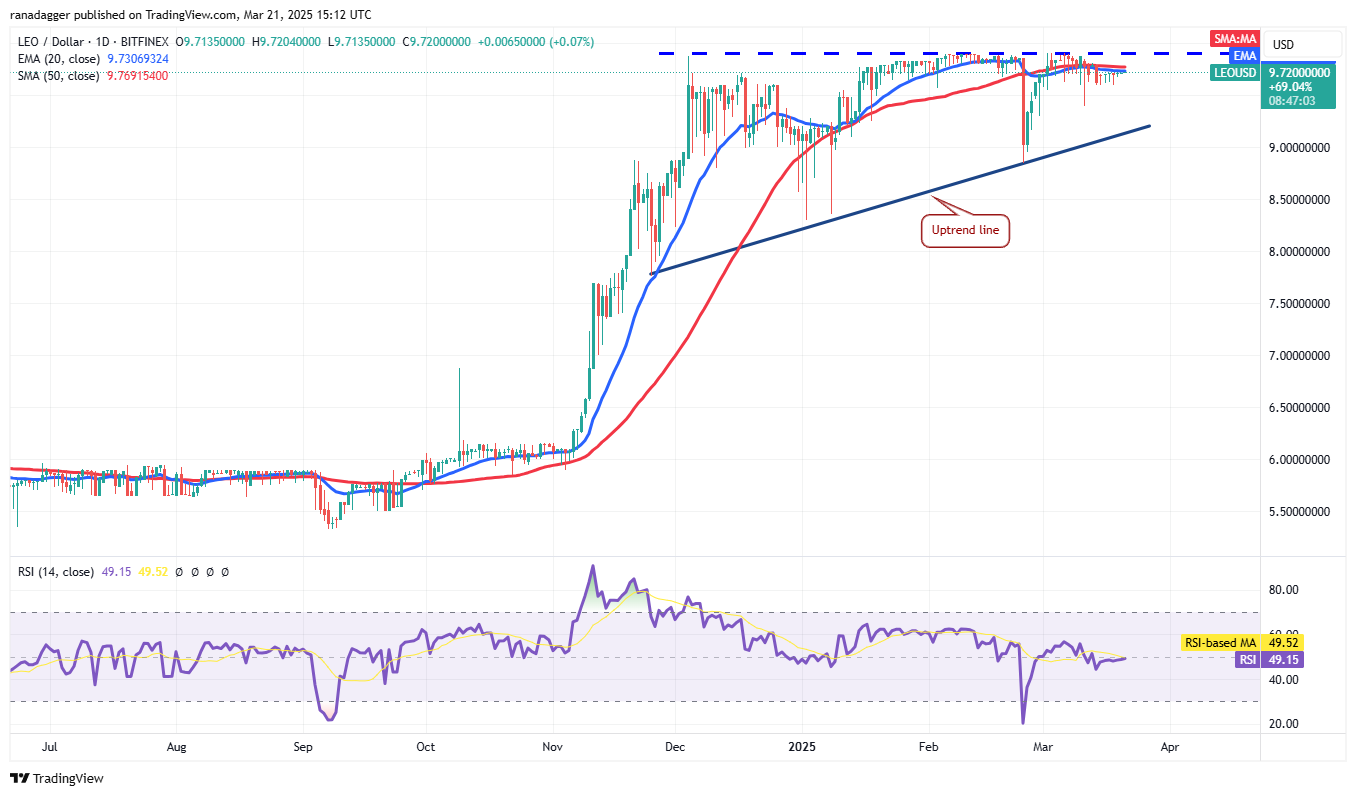
Flat moving averages and an RSI near the midpoint suggest neither bulls nor bears have a clear advantage. A break below $9.60 would strengthen the bearish position, potentially leading to a decline towards the uptrend line.
평평한 이동 평균과 중간 점 근처의 RSI는 황소 나 곰이 명백한 이점을 가지고 있지 않다고 제안합니다. $ 9.60 미만의 휴식은 약세 위치를 강화시켜 잠재적으로 상승 라인으로 감소 할 것입니다.
Conversely, a break and close above $9.90 would complete a bullish ascending triangle pattern, potentially leading to a rise towards the target of $12.04.
반대로, 9.90 달러 이상의 휴식과 마감은 낙관적 인 오름차순 삼각형 패턴을 완성하여 잠재적으로 $ 12.04의 목표를 향해 증가 할 것입니다.
Disclaimer: This article does not provide investment advice. All investment and trading decisions involve risk, and readers should conduct thorough research before making any decisions.
면책 조항 :이 기사는 투자 조언을 제공하지 않습니다. 모든 투자 및 거래 결정에는 위험이 포함되며 독자는 결정을 내리기 전에 철저한 연구를 수행해야합니다.
 DogeHome
 BitcoinInfoNews.Com
 TheCoinrise
 Optimisus
 CryptoNewsLand
 Kanalcoin
 DT News


