

Bitcoin's (BTC) recovery is facing resistance at higher price points, suggesting persistent bearish pressure. Material Indicators reported on X that a significant trader, referred to as "Spoofy the Whale," has been suppressing the price below $87,500.
比特幣(BTC)的恢復正面臨著更高的價格的阻力,表明持續的看跌壓力。 X上報導的物質指標稱,一個稱為“欺騙鯨魚”的重要交易者一直在鎮壓低於87,500美元的價格。
While upward movement is currently constrained, some analysts believe the downside is limited. BitMEX co-founder Arthur Hayes suggested on X that Bitcoin may have bottomed out around $77,000, citing the Federal Reserve's announced slowdown in quantitative tightening starting in April.
儘管目前受到限制,但一些分析人士認為下行一面是有限的。 Bitmex聯合創始人亞瑟·海斯(Arthur Hayes)在X上建議比特幣可能已經觸底了77,000美元,理由是美聯儲宣布從4月開始定量緊縮的放緩。
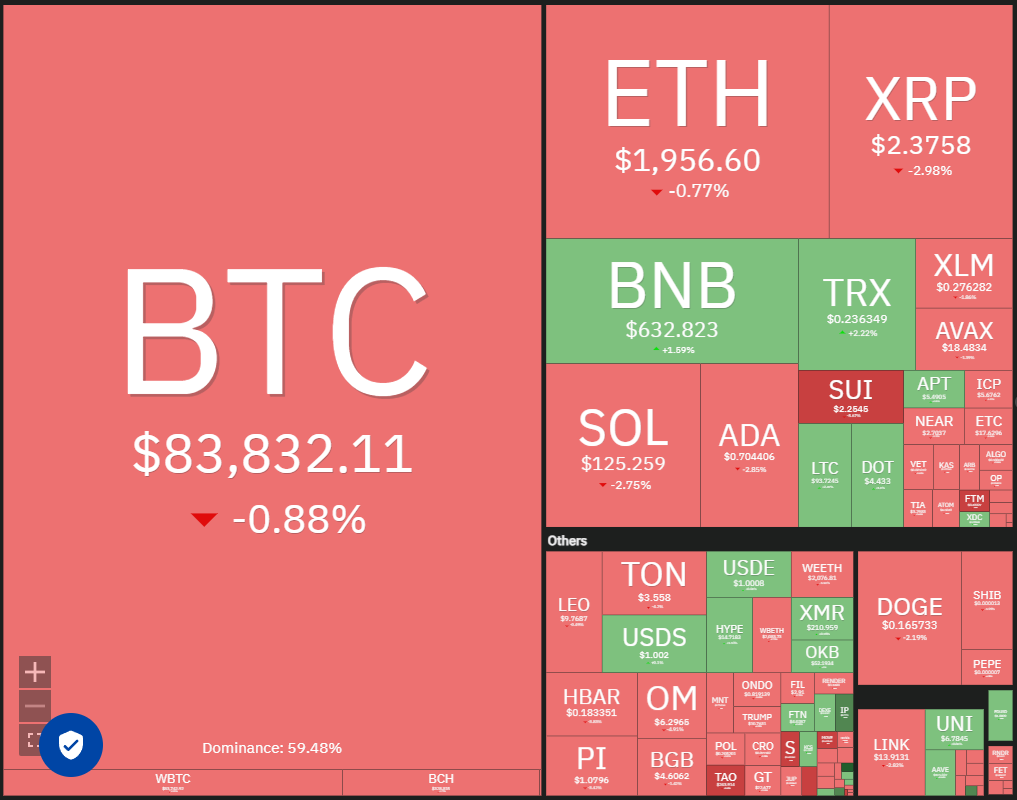
Another potential bullish factor is the possibility of a recession, according to Robbie Mitchnick, head of digital assets at BlackRock. In a Yahoo Finance interview, Mitchnick stated that BlackRock's long-term Bitcoin investors are unfazed by current economic challenges and view the market downturn as a buying opportunity.
貝萊德數字資產負責人羅比·米奇尼克(Robbie Mitchnick)表示,另一個潛在的看漲因素是衰退的可能性。 米奇尼克(Mitchnick)在雅虎財務採訪中說,貝萊克(Blackrock)的長期比特幣投資者對當前的經濟挑戰毫不掩飾,並將市場低迷視為購買機會。
Could Bitcoin establish a higher low and break above $87,500 in the near future? And would that spark increased buying in altcoins? Let's examine the charts of the top 10 cryptocurrencies.
在不久的將來,比特幣能否建立較高的低價和超過$ 87,500的損失? 而且這種火花會增加山寨幣的購買嗎?讓我們檢查前10個加密貨幣的圖表。
Bitcoin Price Analysis
比特幣價格分析
Bitcoin briefly surpassed its 20-day exponential moving average ($85,332) on March 19th, but this relief rally was halted by bearish pressure at the resistance level.
比特幣在3月19日短暫超過了其20天的指數移動平均線(85,332美元),但這種救濟集會因電阻水平的看跌壓力而停止了。
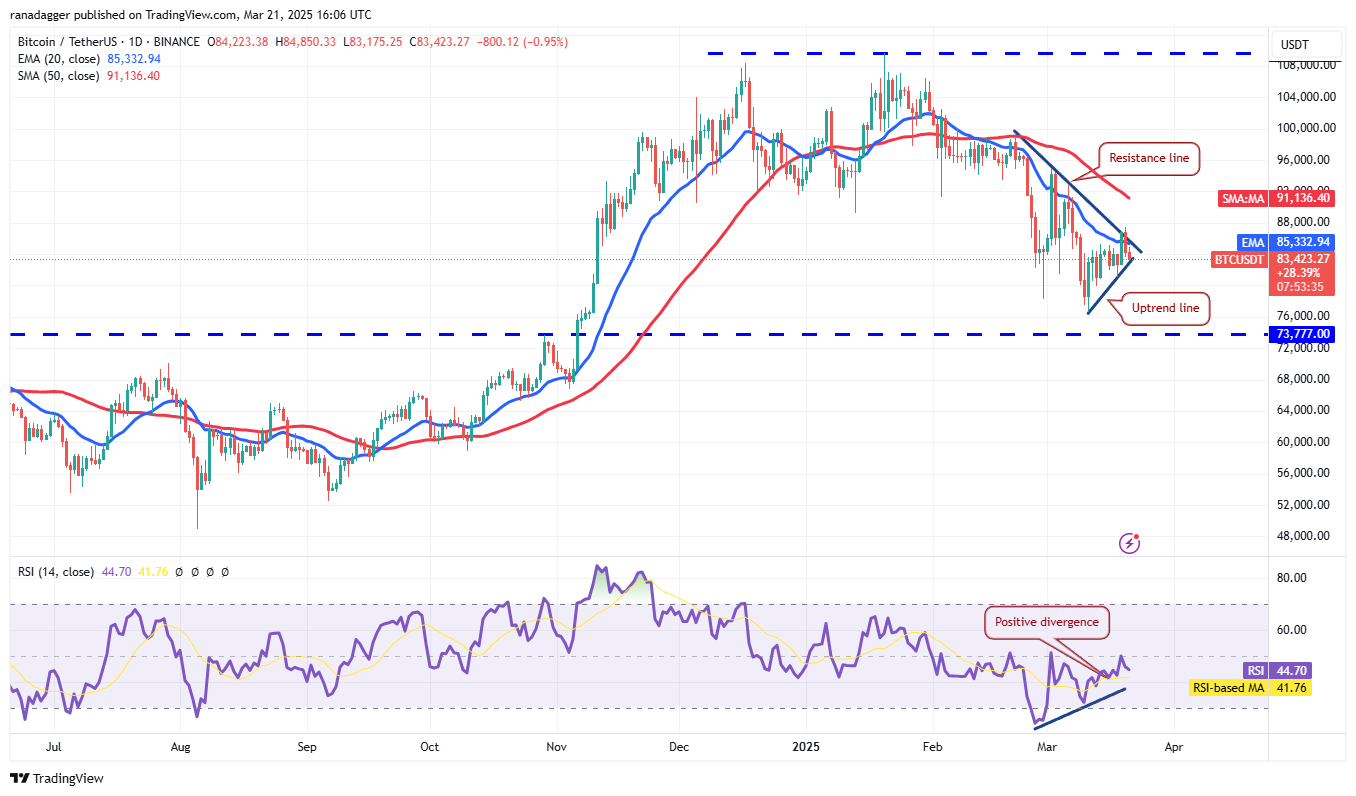
A break below the uptrend line could send BTC/USDT down to $80,000 and potentially further to $76,606. The $76,606 to $73,777 zone is anticipated to attract strong buying, but continued bearish dominance could lead to a decline to $67,000.
低於上升線的休息可能會使BTC/USDT降至80,000美元,並可能進一步降至76,606美元。 預計76,606美元至73,777美元的區域將吸引強勁的購買,但持續的看跌優勢可能會導致下降至67,000美元。
Conversely, a rebound off the uptrend line and a break above $87,500 could trigger a significant upward movement. While the 50-day simple moving average ($91,136) might provide resistance, a break above it could propel the price towards $95,000 and potentially $100,000.
相反,上升趨勢線的反彈和超過$ 87,500的中斷可能會引發重大的向上移動。 雖然50天簡單的移動平均線(91,136美元)可能會提供阻力,但要超過它可能會使價格提高到95,000美元,並可能達到100,000美元。
Ether Price Analysis
以太價格分析
Ether's (ETH) recovery stalled at the 20-day EMA ($2,067), indicating continued bearish activity at higher levels.
Ether(ETH)的恢復停滯在20天EMA(2,067美元),表明較高水平的看跌活動持續。

A drop below $1,927 could push ETH/USDT towards $1,800. Support is expected around $1,750 to $1,800, but a break below this range could trigger a decline to $1,550.
低於$ 1,927的下跌可能會將ETH/USDT推向1,800美元。 支持預計約為1,750美元至1,800美元,但低於此範圍的休息可能會導致下降至1,550美元。
This bearish outlook would be invalidated if the price rises above the breakdown level of $2,111, potentially leading to a rally towards the 50-day SMA ($2,420) and eventually $2,850.
如果價格上漲高於2,111美元的分解水平,這將使這種看跌的前景無效,這可能導致向50天SMA(2,420美元)的集會,最終導致2,850美元。
XRP Price Analysis
XRP價格分析
XRP (XRP) briefly surpassed its moving averages on March 19th, but this momentum proved unsustainable.
XRP(XRP)在3月19日短暫超過了其移動平均值,但事實證明這種勢頭是不可持續的。
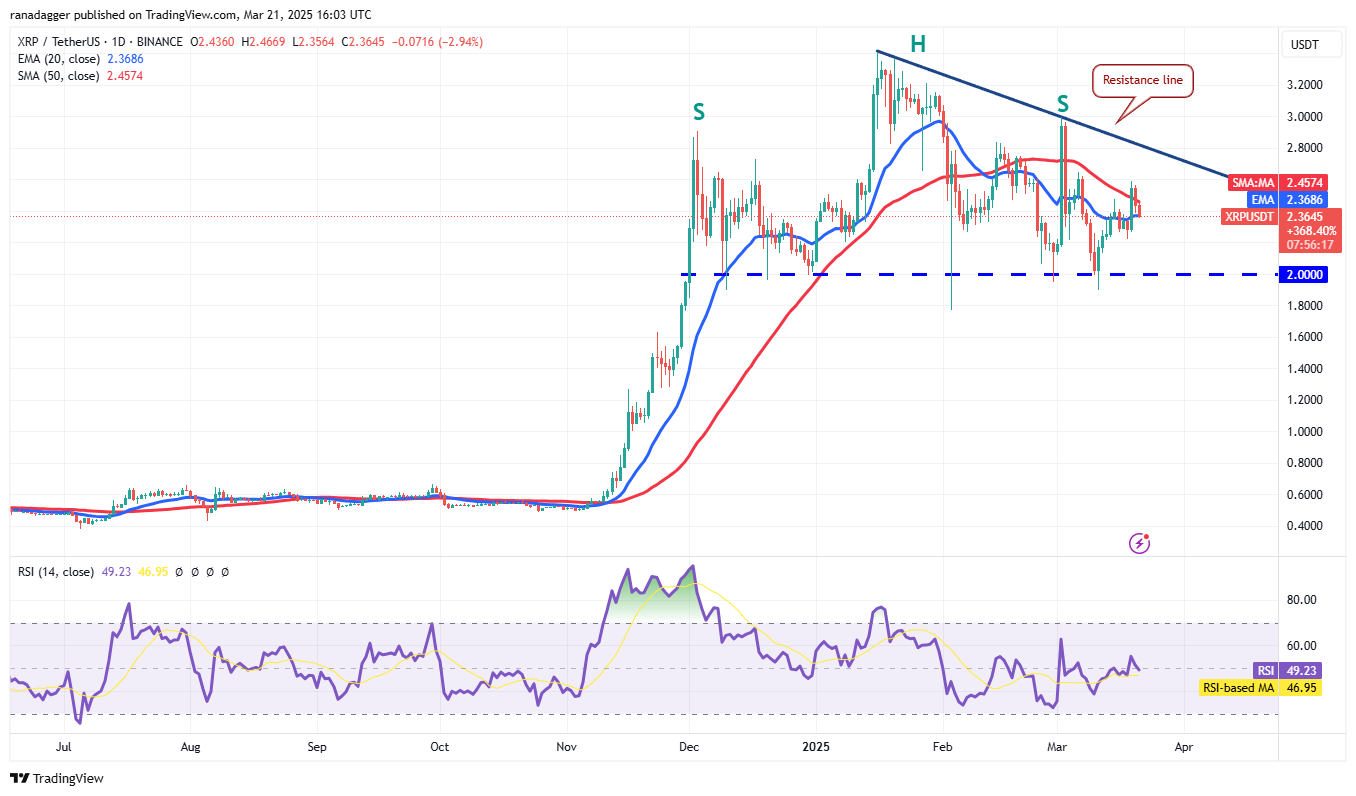
Bearish pressure is attempting to push the price below the 20-day EMA ($2.36). Success could lead to a decline to $2.22 and then to the crucial support at $2. A break below $2 could complete a bearish head-and-shoulders pattern.
看跌壓力試圖將價格推高20天EMA(2.36美元)。 成功可能會導致下降至2.22美元,然後以2美元的價格獲得至關重要的支持。 低於$ 2的休息時間可以完成看跌的頭和露肩圖案。
Conversely, a rebound off the 20-day EMA would signal buying interest, potentially leading to a rise towards the resistance line.
相反,從20天的EMA中反彈將表示購買利息,這可能會導致朝著阻力線上升。
BNB Price Analysis
BNB價格分析
BNB's (BNB) pullback found support at the 20-day EMA ($608) on March 19th, indicating buying on dips.
BNB(BNB)的回調在3月19日在20天EMA(608美元)的支持下獲得了支持,這表明在下降中購買。
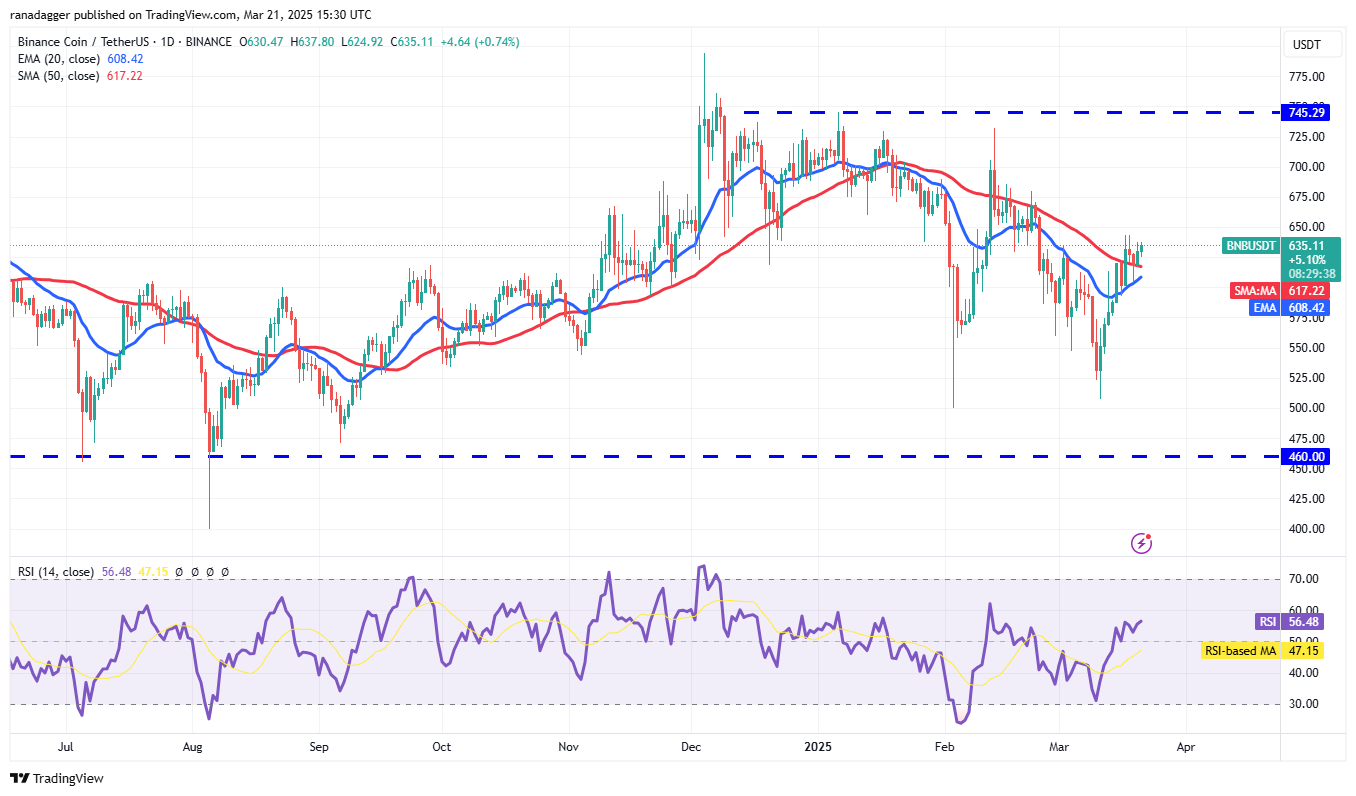
The 20-day EMA is turning upwards, and the RSI is positive, suggesting a slight buyer advantage. A break above $644 could lead to a rally to $686. Resistance is expected around $686, with a break above potentially pushing the price to $745.
20天的EMA正在向上轉動,RSI是積極的,這表明買家的優勢略有優勢。 超過644美元的休息可能會導致集會至686美元。 電阻預計約為686美元左右,超過潛在的價格將價格提高到745美元。
A break below the 20-day EMA would favor sellers, potentially leading to a decline to $550.
低於20天EMA的休息將有利於賣家,可能導致下降至550美元。
Solana Price Analysis
Solana價格分析
Solana (SOL) reversed from the 20-day EMA ($135) on March 20th, suggesting continued selling on minor rallies.
Solana(Sol)從3月20日的20天EMA($ 135)扭轉,表明繼續進行小集會。
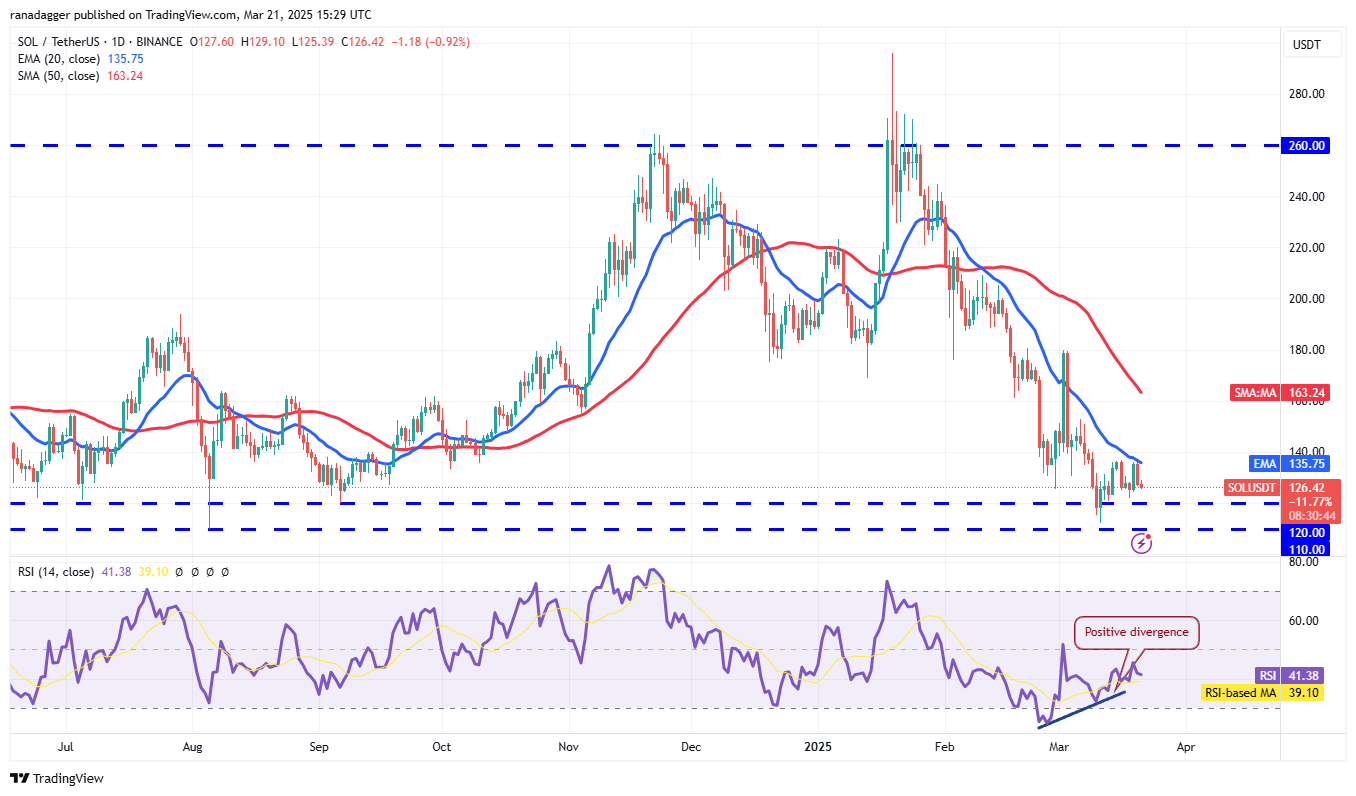
SOL/USDT could fall to $120 and then to $110. Strong support is expected around $110. A rebound from this level could lead to another attempt to break above the 20-day EMA, potentially reaching the 50-day SMA ($163).
SOL/USDT可能跌至120美元,然後降至110美元。 預計大約110美元的支持。 從這個水平的反彈可能會導致另一次超越20天EMA的嘗試,可能達到50天的SMA(163美元)。
However, a break below $110 would likely resume the downtrend, potentially leading to a decline to $98 and then $80.
但是,低於110美元的休息可能會恢復下降趨勢,可能導致下降到98美元,然後下降80美元。
Cardano Price Analysis
Cardano價格分析
Cardano (ADA) reversed from its moving averages on March 20th, indicating bearish defense of the current level.
Cardano(ADA)於3月20日從其移動平均值中撤退,表明對當前水平的看跌防禦。
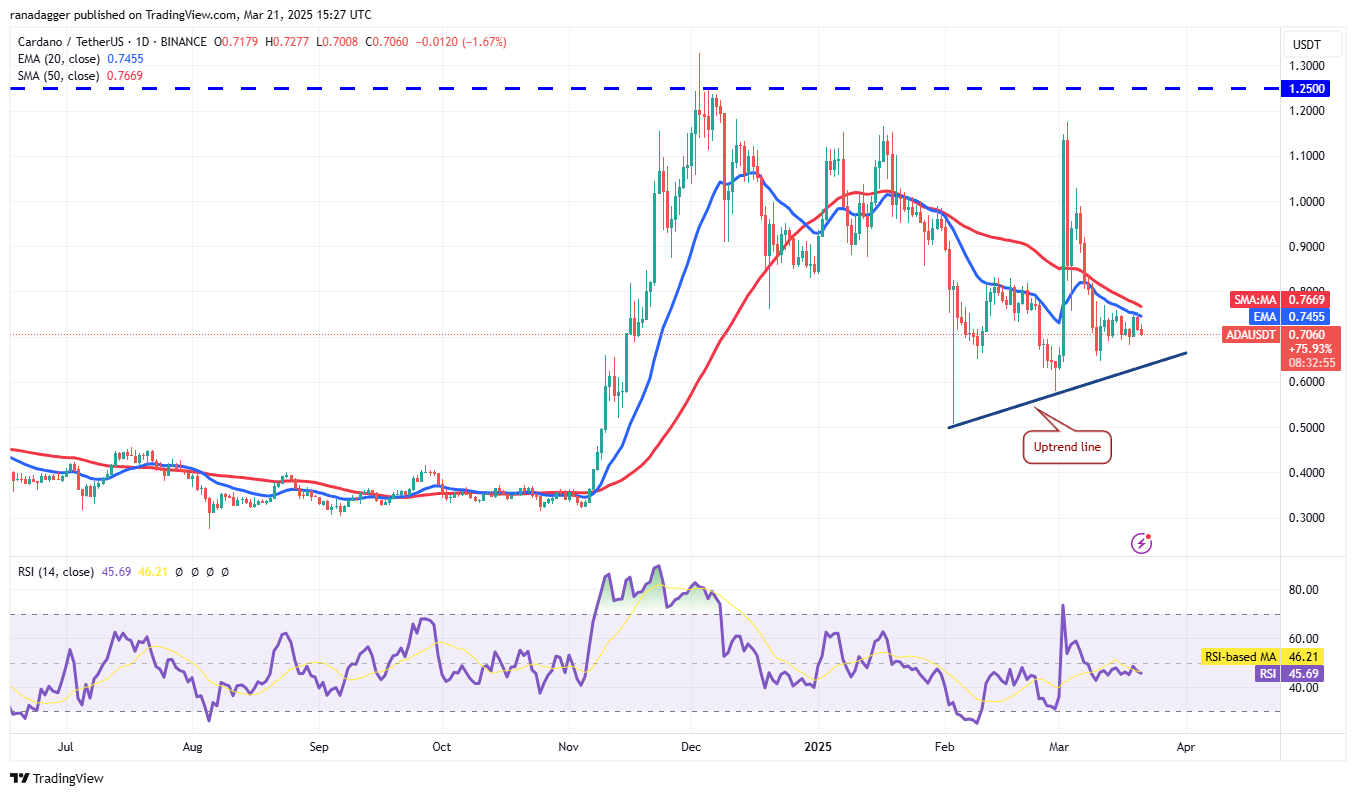
Sellers will likely target the uptrend line, where buying is expected. A strong rebound from the uptrend line could lead to a break above the moving averages and a rally to $1.02.
賣方可能會針對預期購買的上升線。 從上升線的強勁反彈可能會導致超過移動平均值的突破,而集會達到1.02美元。
Conversely, a break below the uptrend line would suggest a shift to bearish dominance, potentially leading to a decline towards $0.58 and then $0.50, where strong buying is anticipated.
相反,低於上升趨勢線的突破將表明向看跌優勢的轉變,可能導致下降到0.58美元,然後將其$ 0.50降低,預計會有強勁的購買。
Dogecoin Price Analysis
Dogecoin價格分析
Buyers are struggling to push Dogecoin (DOGE) above the 20-day EMA ($0.18), reflecting negative sentiment.
買家正在努力將Dogecoin(Doge)推高20天EMA($ 0.18),這反映了負面情緒。
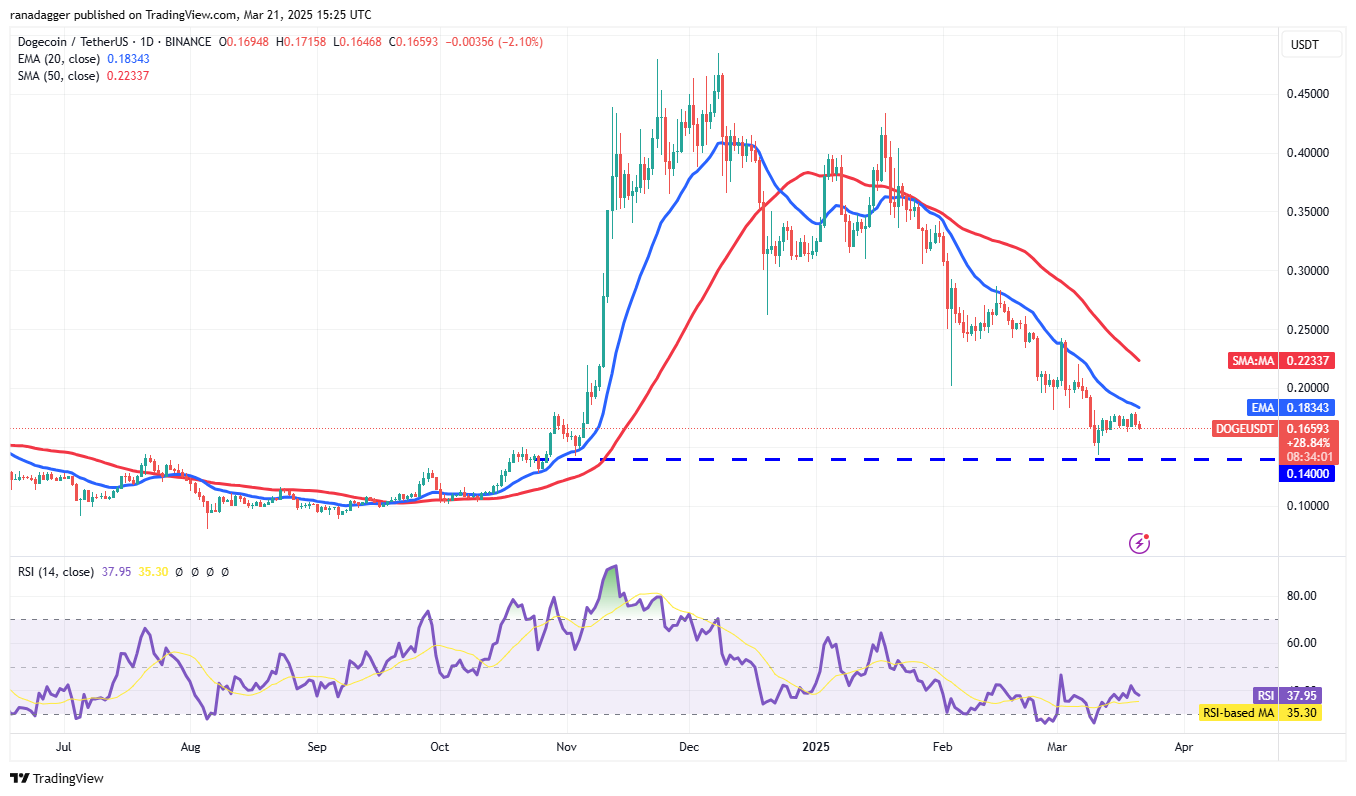
A fall below $0.16 could retest the crucial support at $0.14. This is a key level for bulls to defend; a break below could lead to a decline to $0.10.
低於$ 0.16的下跌可能會以0.14美元的價格重新測試關鍵支持。 這是公牛捍衛的關鍵水平。低於以下的休息可能會導致下降到0.10美元。
Conversely, a break above the 20-day EMA would signal renewed buying interest, potentially leading to a rise towards the 50-day SMA ($0.22) and then to $0.29.
相反,超過20天EMA的休息時間將表示新的購買利息,這可能會導致50天SMA(0.22美元),然後升至0.29美元。
Toncoin Price Analysis
噸幣價格分析
Toncoin (TON) surpassed the 50-day SMA ($3.51) on March 19th, but bears are attempting to halt the upward momentum at $4.
3月19日,Toncoin(Ton)超過了50天的SMA(3.51美元),但熊試圖以4美元的價格停止向上勢頭。
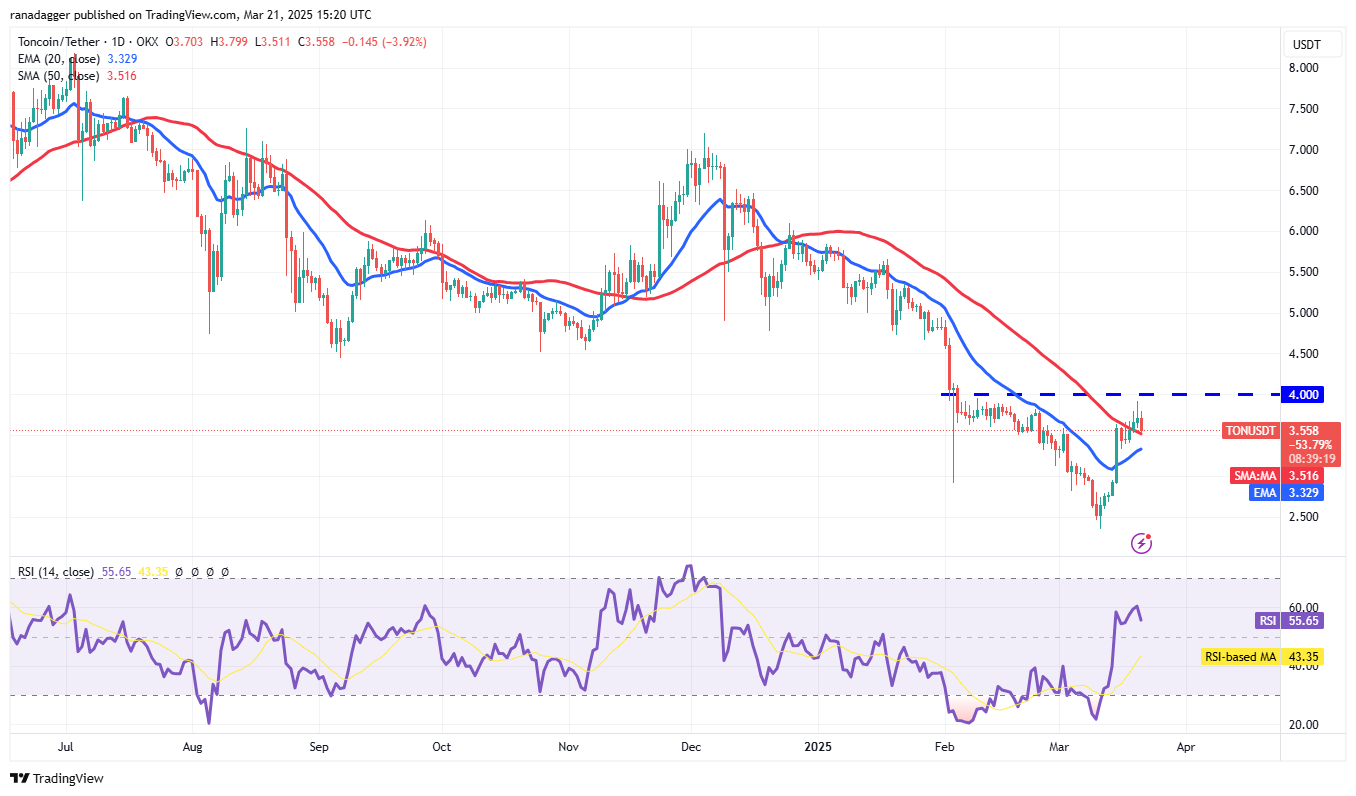
The 20-day EMA ($3.32) is turning upwards, and the RSI is positive, favoring buyers. Support is expected at the 20-day EMA, which could facilitate a break above $4, potentially leading to a rise to $5 and then $5.50.
20天的EMA($ 3.32)正在向上轉動,RSI是積極的,有利於買家。 預計將在20天EMA的支持下提供支持,這可能會促進超過4美元的休息,可能會導致5美元上漲,然後增加5.50美元。
Sellers would need to push the price below the 20-day EMA to regain control, potentially leading to a decline to $3.
賣方將需要將價格推高20天EMA以重新獲得控制,這可能會導致下降到3美元。
Chainlink Price Analysis
連鎖價格分析
Chainlink (LINK) rose above the 20-day EMA ($14.59) on March 19th, but this was short-lived.
3月19日,ChainLink(Link)(鏈接)上升到20天EMA(14.59美元)的高度,但這是短暫的。
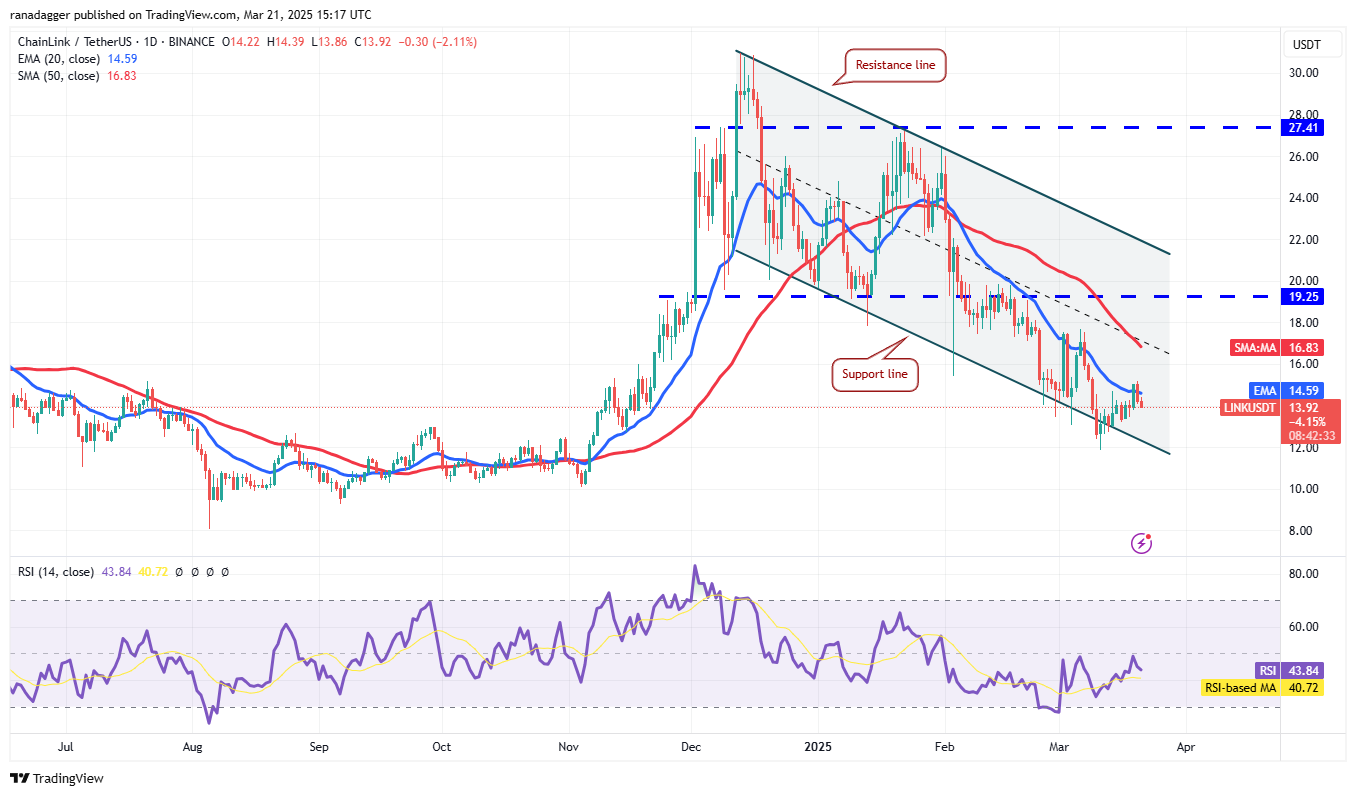
The price fell below the 20-day EMA on March 20th, signaling selling at higher levels. Bears will likely target the crucial support at $12.
價格低於3月20日的20天EMA,標誌著更高水平的銷售。 熊可能以12美元的價格將關鍵支持目標。
A rebound from the current level or $12 would indicate a shift from selling on rallies to buying on dips, potentially leading to a renewed attempt to reach the 50-day SMA ($16.83) and then $19.25.
從目前的水平或12美元的反彈將表明從銷售集會到購買跌幅的轉變,有可能導致重新嘗試達到50天SMA(16.83美元),然後是19.25美元。
A continued decline below $12 would likely lead to a drop towards the psychological support level of $10.
持續下降到12美元以下的下降可能會導致心理支持水平下降10美元。
UNUS SED LEO Price Analysis
一個但是獅子的價格分析
UNUS SED LEO (LEO) remains below the resistance at $10, indicating persistent bearish pressure.
Unus sed Leo(Leo)保持在10美元以下的電阻以下,表明持續的看跌壓力。
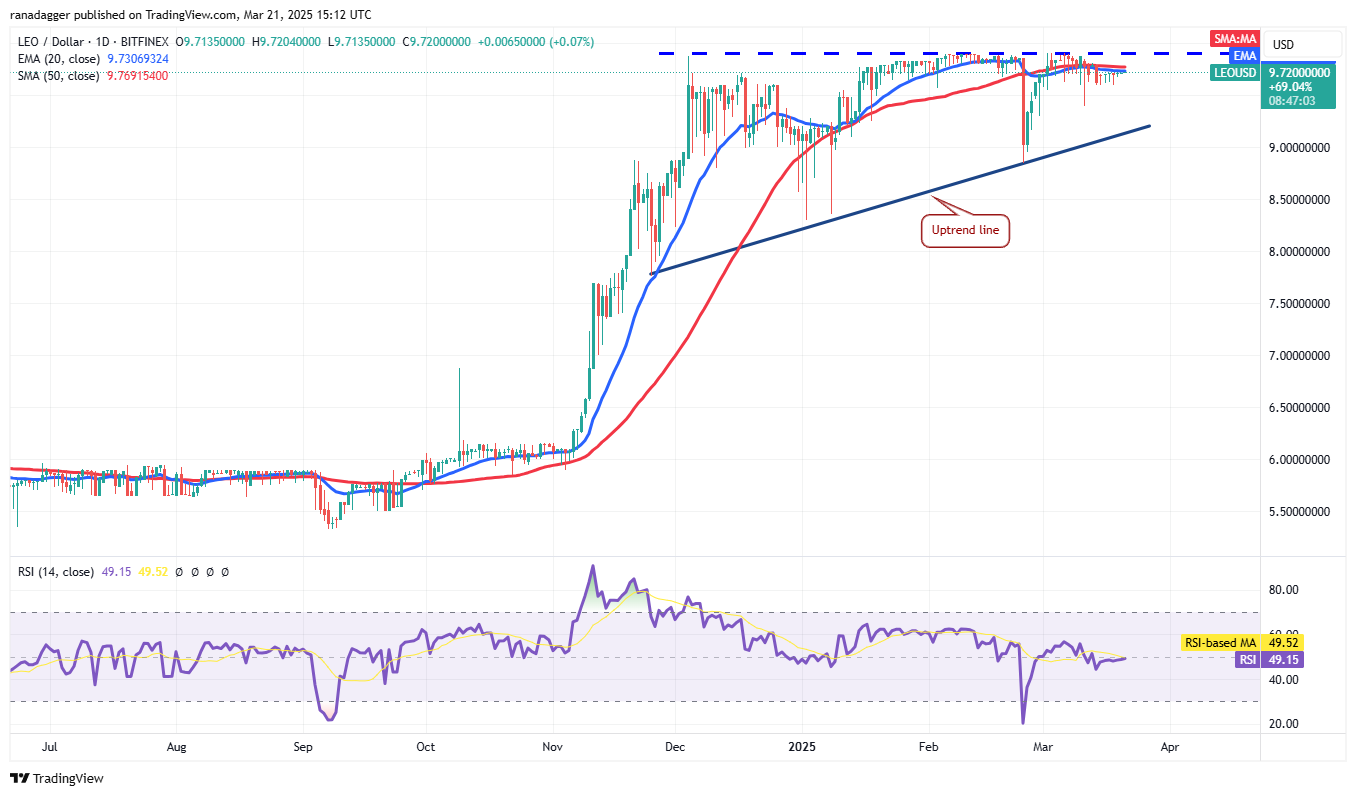
Flat moving averages and an RSI near the midpoint suggest neither bulls nor bears have a clear advantage. A break below $9.60 would strengthen the bearish position, potentially leading to a decline towards the uptrend line.
平均平均值和中點附近的RSI表明公牛和熊都沒有明顯的優勢。 低於$ 9.60的休息時間將加強看跌的位置,有可能導致上升趨勢線的下降。
Conversely, a break and close above $9.90 would complete a bullish ascending triangle pattern, potentially leading to a rise towards the target of $12.04.
相反,休息時間超過$ 9.90將完成單價上升的三角形模式,可能導致目標上升到12.04美元。
Disclaimer: This article does not provide investment advice. All investment and trading decisions involve risk, and readers should conduct thorough research before making any decisions.
免責聲明:本文不提供投資建議。所有投資和交易決策都涉及風險,讀者應在做出任何決定之前進行徹底的研究。
 DogeHome
 BitcoinInfoNews.Com
 TheCoinrise
 Optimisus
 CryptoNewsLand
 Kanalcoin
 DT News


