If you think meme coin mania happened in March and then stopped, you are probably not accurate. Whenever the market recovers, meme coins are usually the first ones to produce big gains. This is why POPCAT or WIF are among top gainers today as the broader crypto market pumps.
밈 코인 매니아가 3월에 발생했다가 중단되었다고 생각한다면 아마도 정확하지 않을 것입니다. 시장이 회복될 때마다 밈 코인은 일반적으로 가장 먼저 큰 이익을 창출하는 코인입니다. 이것이 바로 POPCAT이나 WIF가 오늘날 더 넓은 암호화폐 시장이 상승하면서 최고의 상승세를 보이는 이유입니다.
But, what’s going on with the king of all memes? Well, Dogecoin’s market performance has not done badly over the past day, as its price saw a 5% pump. This means the DOGE price is now trading slightly below $0.11 resistance range.
그런데 모든 밈의 왕에게 무슨 일이 일어나고 있는 걸까요? 음, Dogecoin의 시장 실적은 가격이 5% 상승했기 때문에 지난 하루 동안 나쁘지 않았습니다. 이는 현재 DOGE 가격이 $0.11 저항 범위보다 약간 아래에서 거래되고 있음을 의미합니다.
A known analyst on X (formerly known as Twitter) who goes by “Ali Charts” shared with his 71.1k followers that DOGE is gearing up for a bullish breakout and two key signals should be watched.
"Ali Charts"를 사용하는 X(이전의 Twitter)의 유명한 분석가는 DOGE가 강세 돌파를 준비하고 있으며 두 가지 주요 신호를 관찰해야 한다고 71.1k 팔로어와 공유했습니다.
Dogecoin Chart Analysis: Falling Wedge Indicates Potential Upside
Dogecoin 차트 분석: 하락하는 쐐기 모양은 잠재적인 상승 가능성을 나타냅니다.
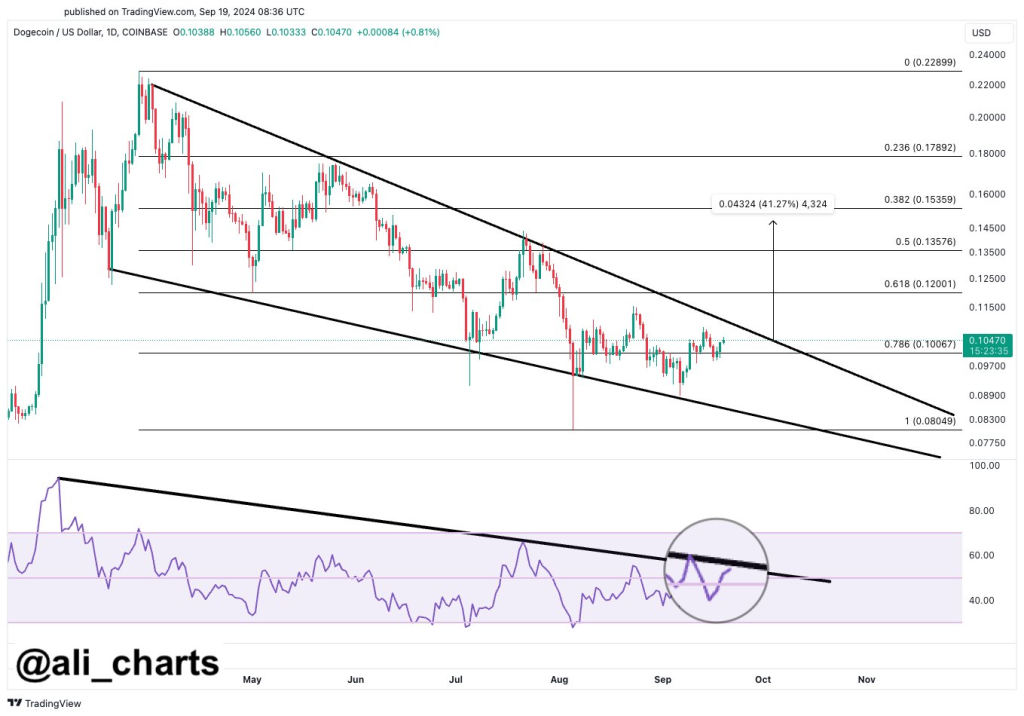
Ali’s chart analysis indicated that DOGE is moving within a falling wedge pattern, which is seen as a bullish reversal indicator. The upper line of this wedge acts as resistance, while the lower boundary provides support.
Ali의 차트 분석에 따르면 DOGE는 하락 쐐기 패턴 내에서 움직이고 있으며 이는 강세 반전 지표로 간주됩니다. 이 쐐기의 위쪽 선은 저항 역할을 하고 아래쪽 경계선은 지지 역할을 합니다.
As long as DOGE remains within this pattern, price fluctuations between these boundaries can be expected. A breakout beyond this wedge pattern could signal a shift upward.
DOGE가 이 패턴 내에 머무르는 한 이러한 경계 사이의 가격 변동이 예상될 수 있습니다. 이 쐐기 패턴을 넘어서는 돌파는 상승 전환 신호일 수 있습니다.

Key Signals: RSI and Resistance at $0.11
주요 신호: $0.11의 RSI 및 저항
Ali pointed to two essential signals that could confirm a breakout for Dogecoin. The first is the RSI breaking above its descending trendline. This would indicate increased buying momentum, a key signal for a bullish move.
Ali는 Dogecoin의 돌파를 확인할 수 있는 두 가지 필수 신호를 지적했습니다. 첫 번째는 RSI가 하락 추세선을 돌파하는 것입니다. 이는 매수 모멘텀 증가를 의미하며, 이는 강세 움직임의 핵심 신호입니다.
However, a pump past the $0.11 resistance level would confirm the breakout from the falling wedge. This $0.11 level correlates with the upper line of the wedge, making it a key resistance level.
그러나 0.11달러의 저항 수준을 넘어서는 펌프질은 하락쐐기형의 돌파를 확증할 것입니다. 이 0.11달러 수준은 쐐기 상단선과 상관관계가 있어 주요 저항 수준이 됩니다.
Moreover, if the token breaks above this point, it could encourage further gains, with $0.12 and $0.15 being the next possible resistance levels.
또한, 토큰이 이 지점을 넘어설 경우 $0.12와 $0.15가 다음 저항 수준이 되어 추가 이익을 얻을 수 있습니다.
Dogecoin Price Forecast
Dogecoin 가격 예측
The analyst price targets correspond to the 0.618 and 0.382 Fibonacci levels, respectively, offering an upside potential of over 40%.
분석가의 목표 가격은 각각 0.618 및 0.382 피보나치 수준에 해당하며 40% 이상의 상승 잠재력을 제공합니다.
Finally, failure to break above these key signals could see DOGE testing lower levels, including the support around $0.089. Traders should closely monitor these technical indicators for further price action.
마지막으로 이러한 주요 신호를 초과하지 못하면 DOGE가 약 $0.089의 지원을 포함하여 더 낮은 수준을 테스트하는 것을 볼 수 있습니다. 거래자는 추가 가격 조치를 위해 이러한 기술 지표를 면밀히 모니터링해야 합니다.
Follow us on X (Twitter), CoinMarketCap and Binance Square for more daily crypto updates.
더 많은 일일 암호화폐 업데이트를 보려면 X(Twitter), CoinMarketCap 및 Binance Square를 팔로우하세요.


 Crypto Daily™
 BlockchainReporter
 TheCoinrise Media
 DogeHome
 Crypto Daily™
 Crypto Daily™
 TheCoinrise Media
 Thecoinrepublic.com


