If you think meme coin mania happened in March and then stopped, you are probably not accurate. Whenever the market recovers, meme coins are usually the first ones to produce big gains. This is why POPCAT or WIF are among top gainers today as the broader crypto market pumps.
ミームコインマニアが3月に発生し、その後停止したと考えている場合、それはおそらく正確ではありません。市場が回復すると、通常、最初に大きな利益を生み出すのはミームコインです。これが、POPCAT または WIF が今日、より広範な暗号通貨市場のポンプとしてトップの利益を上げている理由です。
But, what’s going on with the king of all memes? Well, Dogecoin’s market performance has not done badly over the past day, as its price saw a 5% pump. This means the DOGE price is now trading slightly below $0.11 resistance range.
しかし、すべてのミームの王様に何が起こっているのでしょうか?さて、ドージコインの価格は 5% 上昇したため、過去 1 日の市場パフォーマンスは悪くありませんでした。これは、DOGE価格が現在0.11ドルの抵抗範囲をわずかに下回って取引されていることを意味します。
A known analyst on X (formerly known as Twitter) who goes by “Ali Charts” shared with his 71.1k followers that DOGE is gearing up for a bullish breakout and two key signals should be watched.
「アリ・チャート」として知られるX(旧ツイッター)の著名なアナリストは、DOGEが強気のブレイクアウトに向けて準備を進めており、2つの重要なシグナルに注目する必要があると7万1100人のフォロワーに共有した。
Dogecoin Chart Analysis: Falling Wedge Indicates Potential Upside
ドージコインチャート分析:下降ウェッジは潜在的な上値を示す
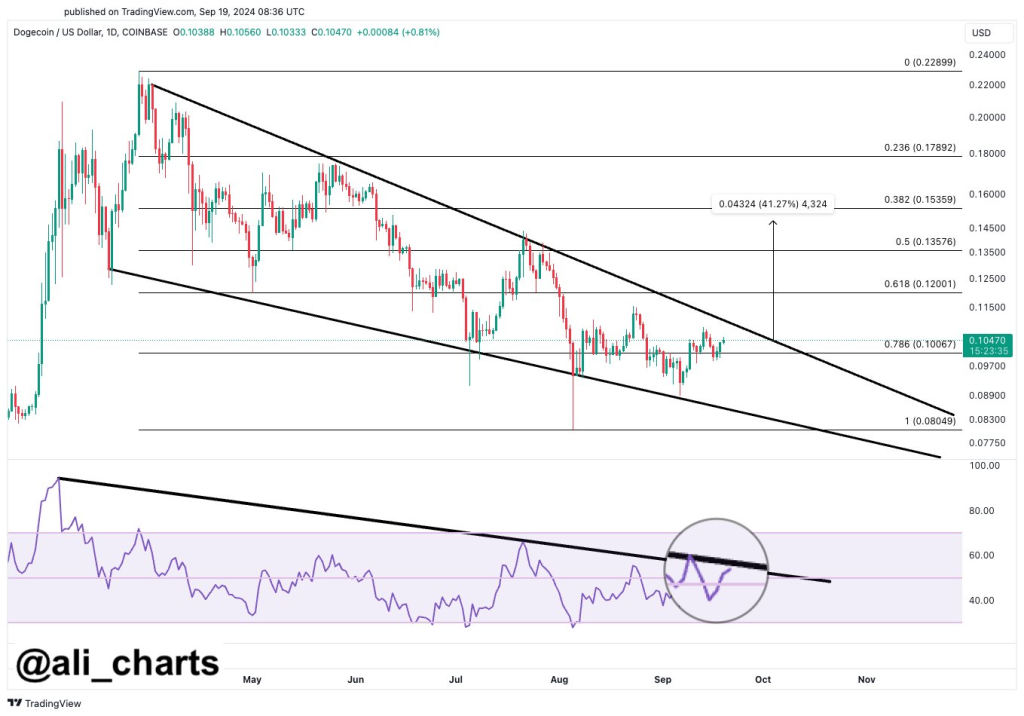
Ali’s chart analysis indicated that DOGE is moving within a falling wedge pattern, which is seen as a bullish reversal indicator. The upper line of this wedge acts as resistance, while the lower boundary provides support.
アリ氏のチャート分析は、DOGEが下降ウェッジパターン内で推移していることを示しており、これは強気の反転指標と見なされています。このウェッジの上部の線は抵抗として機能し、下部の境界はサポートとして機能します。
As long as DOGE remains within this pattern, price fluctuations between these boundaries can be expected. A breakout beyond this wedge pattern could signal a shift upward.
DOGE がこのパターン内にある限り、これらの境界間での価格変動が予想されます。このウェッジパターンを超えるブレイクアウトは、上向きのシフトを示す可能性があります。

Key Signals: RSI and Resistance at $0.11
主なシグナル: RSI と 0.11 ドルの抵抗
Ali pointed to two essential signals that could confirm a breakout for Dogecoin. The first is the RSI breaking above its descending trendline. This would indicate increased buying momentum, a key signal for a bullish move.
アリ氏は、ドージコインのブレイクアウトを裏付ける可能性のある2つの重要なシグナルを指摘した。 1つ目は、RSIが下降トレンドラインを上抜けたことです。これは買いの勢いが高まっていることを示しており、強気の動きの重要なシグナルとなるだろう。
However, a pump past the $0.11 resistance level would confirm the breakout from the falling wedge. This $0.11 level correlates with the upper line of the wedge, making it a key resistance level.
しかし、0.11ドルの抵抗レベルを超えれば、下降ウェッジからのブレイクアウトが確認されるだろう。この0.11ドルのレベルはウェッジの上限ラインと相関しており、重要な抵抗レベルとなります。
Moreover, if the token breaks above this point, it could encourage further gains, with $0.12 and $0.15 being the next possible resistance levels.
さらに、トークンがこのポイントを上抜けた場合、0.12ドルと0.15ドルが次に考えられる抵抗レベルとなり、さらなる上昇を促す可能性があります。
Dogecoin Price Forecast
ドージコイン価格予測
The analyst price targets correspond to the 0.618 and 0.382 Fibonacci levels, respectively, offering an upside potential of over 40%.
アナリストの目標株価はそれぞれ0.618と0.382フィボナッチレベルに相当し、40%を超える上昇の可能性がある。
Finally, failure to break above these key signals could see DOGE testing lower levels, including the support around $0.089. Traders should closely monitor these technical indicators for further price action.
最後に、これらの重要なシグナルを上抜けられなければ、DOGE は 0.089 ドル付近のサポートを含め、より低いレベルをテストする可能性があります。トレーダーは、今後の価格動向について、これらのテクニカル指標を注意深く監視する必要があります。
Follow us on X (Twitter), CoinMarketCap and Binance Square for more daily crypto updates.
X (Twitter)、CoinMarketCap、Binance Square をフォローして、仮想通貨に関する毎日の最新情報を入手してください。


 Crypto Daily™
 BlockchainReporter
 TheCoinrise Media
 DogeHome
 Crypto Daily™
 Crypto Daily™
 TheCoinrise Media
 Thecoinrepublic.com


