Bitcoin's Slump Impacts Memecoins
비트코인의 슬럼프가 Memecoins에 영향을 미침
Despite Bitcoin's recent sluggishness, the memecoin craze has largely subsided. Dogecoin, the leading memecoin, has turned bearish due to Bitcoin's bearish signals. However, DOGE remains within a bullish range, while Shiba Inu may experience a pullback and stay within its range, despite a 12% rise in the last 48 hours.
최근 비트코인의 부진에도 불구하고 밈코인 열풍은 크게 가라앉았습니다. 선도적인 밈코인인 도지코인(Dogecoin)은 비트코인의 약세 신호로 인해 약세로 변했습니다. 그러나 DOGE는 여전히 강세 범위 내에 있는 반면 Shiba Inu는 지난 48시간 동안 12% 상승했음에도 불구하고 하락을 경험하여 범위 내에 머물 수 있습니다.
Dogecoin's Consolidation Before a Potential Move
잠재적인 움직임 전 Dogecoin의 통합
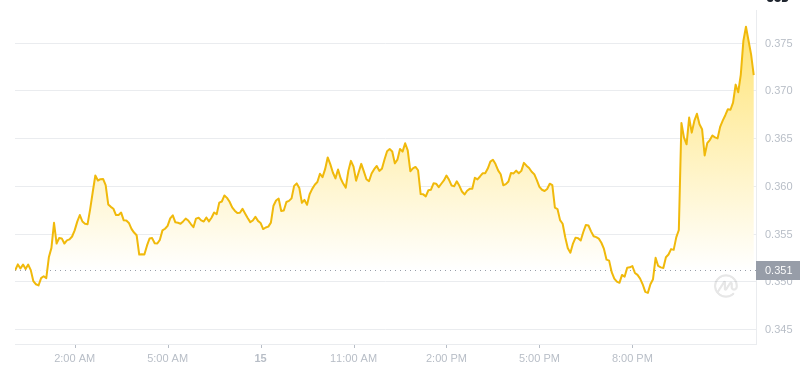
DOGE's price surged over 150% after breaking above $0.15, forming a bullish pattern. It currently trades within a rising parallel channel, with bulls maintaining the rally above average levels. This dominance may result in continued consolidation and an ascending trend.
DOGE의 가격은 0.15달러를 돌파한 후 150% 이상 급등하여 강세 패턴을 형성했습니다. 현재는 상승하는 평행 채널 내에서 거래되고 있으며 황소는 평균 수준 이상의 랠리를 유지하고 있습니다. 이러한 지배력은 지속적인 통합과 상승 추세를 가져올 수 있습니다.
DOGE's price action suggests a bull flag formation within the rising channel. Contracted and parallel Bollinger bands indicate reduced volatility. The MACD shows a drop in volume and pressure, but bulls support the rally, potentially priming the price for a significant rise to $0.55 if resistance is breached.
DOGE의 가격 조치는 상승 채널 내에서 황소 깃발이 형성되었음을 시사합니다. 축소된 평행 볼린저 밴드는 변동성이 감소했음을 나타냅니다. MACD는 거래량과 압력이 하락하고 있지만 강세장이 랠리를 지지하고 있어 저항선이 돌파될 경우 가격이 0.55달러까지 크게 오를 가능성이 있습니다.
Shiba Inu's Decisive Phase
시바견의 결정적인 단계
Shiba Inu operates within a rising wedge, generally considered bearish long-term. Market participants may anticipate a buying opportunity in the first fortnight, possibly continuing the trend until year-end. This could propel SHIB's price beyond its previous high and create a new ATH.
Shiba Inu는 일반적으로 장기적으로 약세로 간주되는 상승 쐐기 내에서 작동합니다. 시장 참여자들은 첫 2주 동안 매수 기회를 예상할 수 있으며, 아마도 연말까지 이러한 추세가 지속될 가능성이 있습니다. 이는 SHIB의 가격을 이전 최고치 이상으로 끌어올려 새로운 ATH를 창출할 수 있습니다.
However, the SHIB price tests the support level of the wedge. Bearish technicals hint at a potential breach of the lower support. The MACD exhibits dwindling buying pressure and a bearish crossover. The RSI nears support at 57.87, with a drop below signaling a new bearish trend, potentially dragging levels below $0.00003. Despite this, the price may bounce back as a good buying opportunity, aiming to reclaim highs above $0.000035 by the end of 2024.
그러나 SHIB 가격은 웨지의 지지 수준을 테스트합니다. 약세 기술은 낮은 지지선을 위반할 가능성이 있음을 암시합니다. MACD는 매수세 감소와 약세 교차를 보이고 있습니다. RSI는 57.87에서 지지에 가까워졌고, 아래로 떨어지면 새로운 약세 추세가 나타나 $0.00003 아래로 떨어질 가능성이 있습니다. 그럼에도 불구하고 가격은 2024년 말까지 $0.000035 이상의 최고치를 되찾는 것을 목표로 하는 좋은 매수 기회로 반등할 수 있습니다.


 Thecryptoupdates
 Crypto Intelligence
 CoinsProbe
 Crypto News Land
 DogeHome
 InsideBitcoin News
 Coin Edition
 InsideBitcoin News
 Crypto Intelligence


