- Dogecoin records growth in the last month amid the meme market decline.
- The gains may be wiped off soon, as key indicators showed that the bears remain in market control.
Dogecoin [DOGE] is the only leading meme coin to post gains in the last month, as meme coin market activity witnessed a decline, IntoTheBlock noted in a post on X (formerly Twitter).
在meme 市場下滑的情況下,狗狗幣在上個月錄得增長。唯一出現上漲的主要meme 代幣IntoTheBlock 在 X(以前稱為 Twitter)上的一篇貼文中指出,隨著迷因幣市場活動的下降。
According to the on-chain data provider, DOGE’s price climbed by 4.43% during the 30-day period.
根據鏈上數據提供者的數據,DOGE 的價格在 30 天內上漲了 4.43%。
During this window period, the values of other leading assets, such as Pepe [PEPE] and Shiba Inu [SHIB], plunged by 33% and 25.28%, respectively.
在此窗口期內,佩佩[PEPE]和柴犬[SHIB]等其他領先資產的價值分別暴跌33%和25.28%。
Can DOGE extend these gains?
DOGE traded at $0.15 at press time. According to CoinMarketCap’s data, the meme coin’s price recorded a 6% price decline in the past 24 hours, mirroring the general market decline.
DOGE 能否延續這些漲幅?根據 CoinMarketCap 的數據,meme 幣的價格在過去 24 小時內下跌了 6%,反映了整體市場的下跌。
Data from CoinGecko showed that the global cryptocurrency market capitalization dropped by 2.38% during the same period.
CoinGecko數據顯示,同期全球加密貨幣市值下跌2.38%。
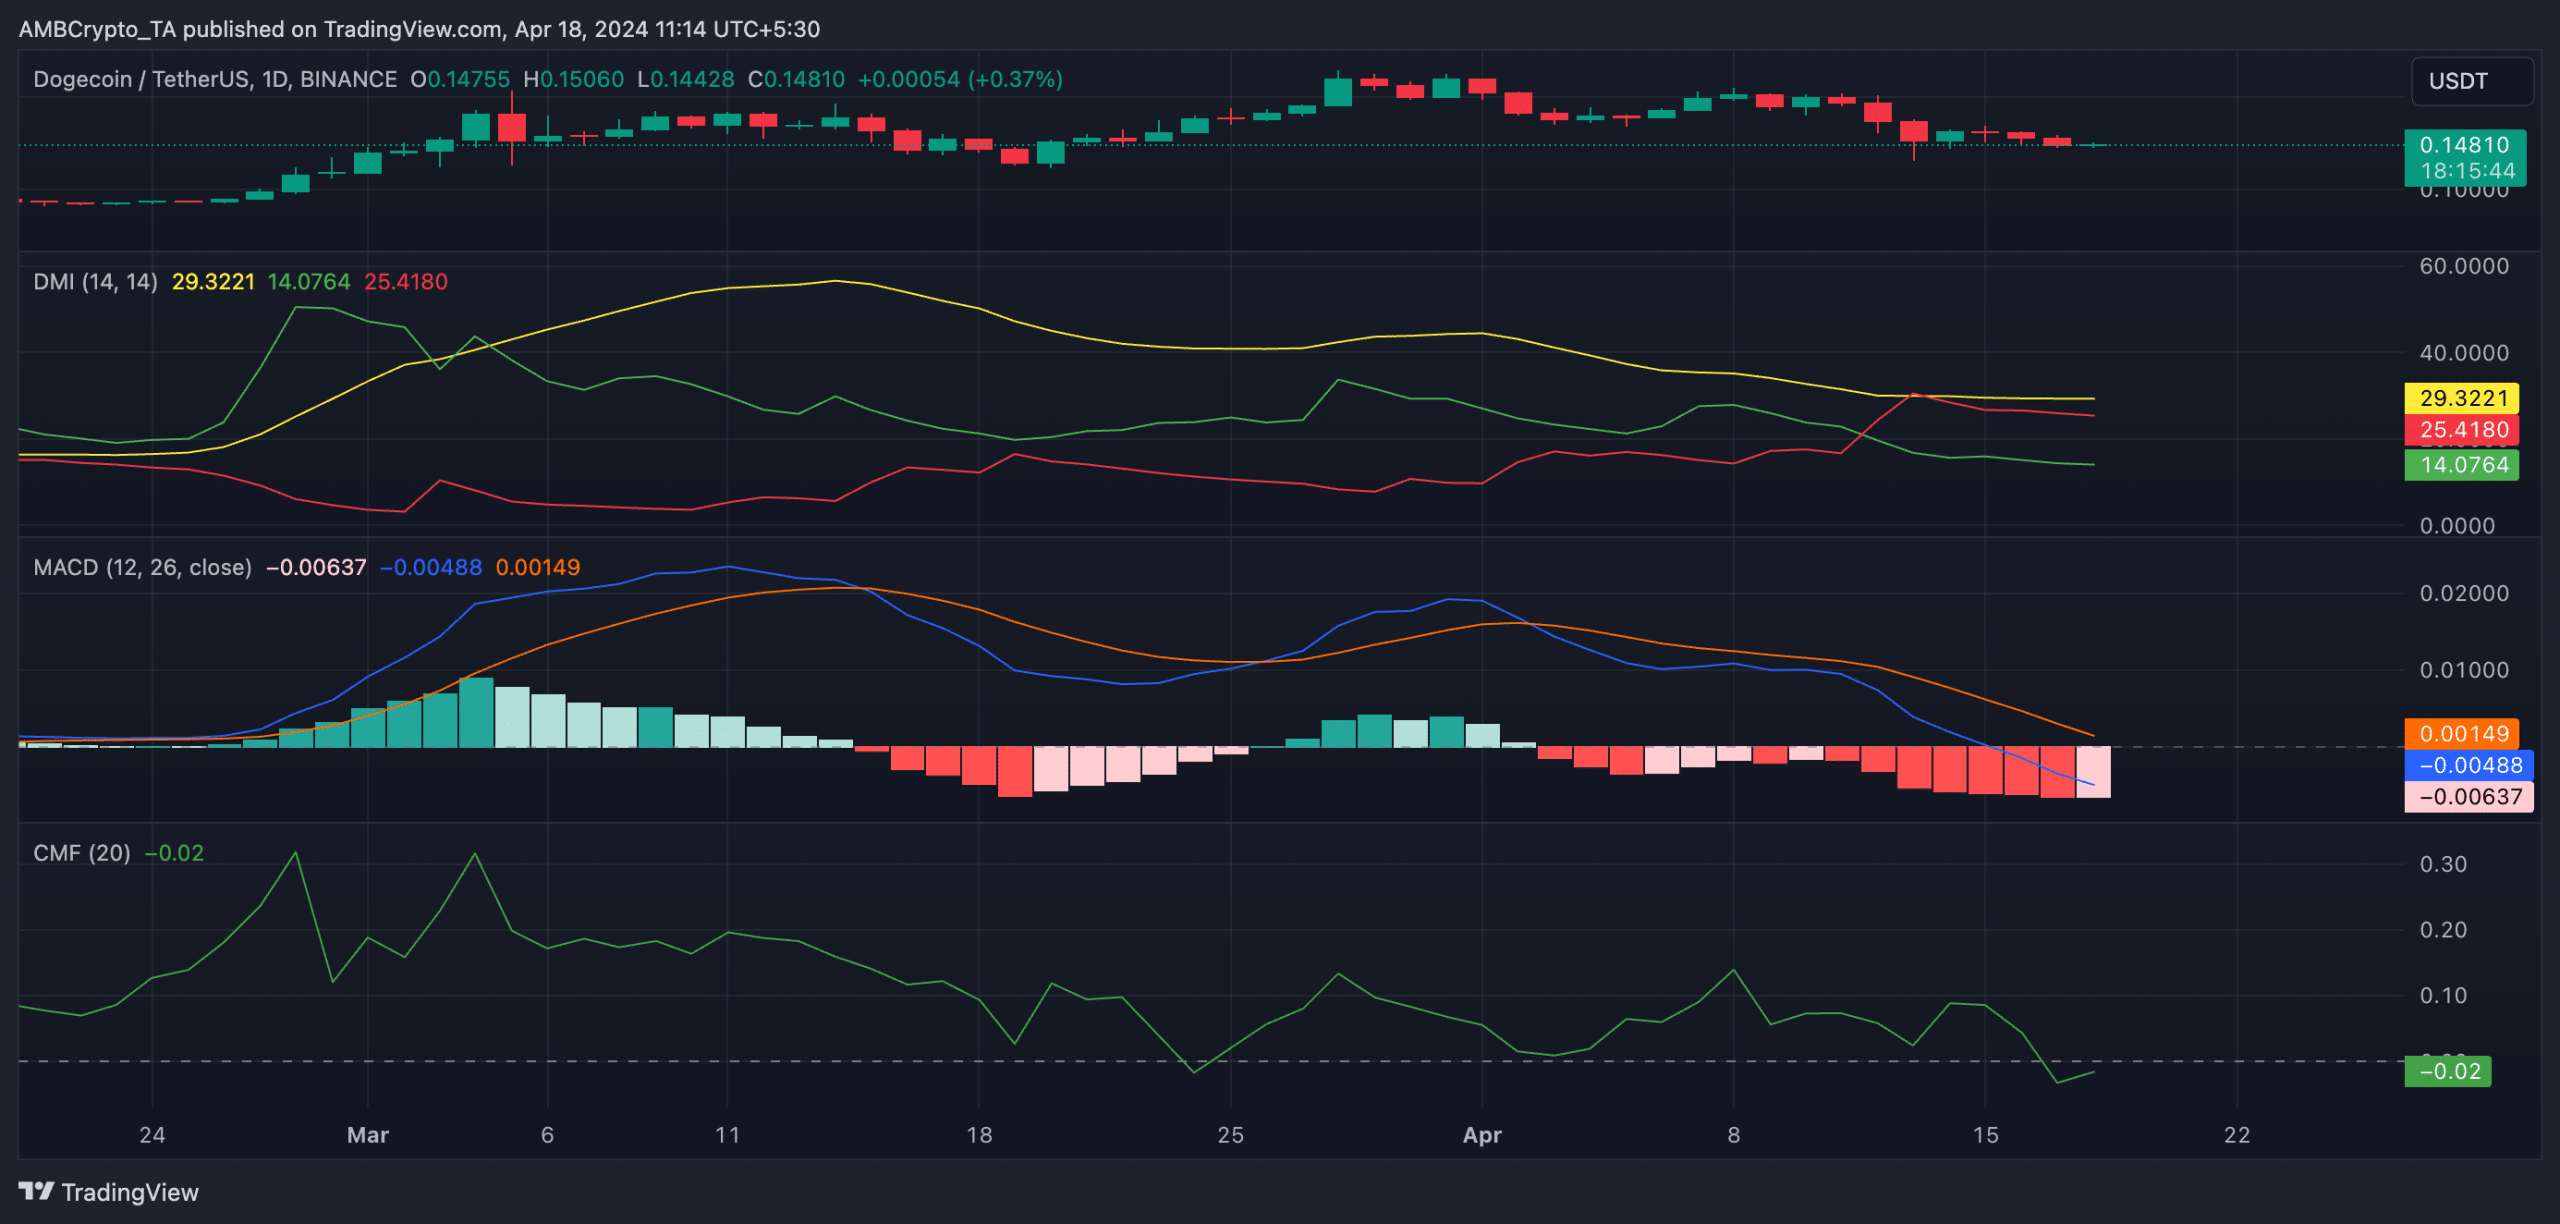
In assessing whether DOGE would extend its 30-day gains, AMBCrypto assessed its key technical indicators on a 1-day chart and discovered that bearish sentiments remained significant.
在評估 DOGE 是否會延續 30 日漲幅時,AMBCrypto 評估了 1 日圖表上的關鍵技術指標,發現看跌情緒依然顯著。
For example, readings from its Moving Average Convergence Divergence (MACD) indicator showed its MACD line resting below its signal line. These lines have been positioned this way since 2nd April.
例如,移動平均收斂分歧 (MACD) 指標的讀數顯示 MACD 線位於訊號線下方。自 4 月 2 日起,這些線路就一直如此定位。
When an asset’s MACD line falls below its signal line, its small moving average is below its longer-term moving average.
當資產的 MACD 線跌破其訊號線時,其小移動平均線低於其長期移動平均線。
It often signals a shift in momentum from bullish to bearish, and traders take it as a sign to sell their holdings.
它通常標誌著勢頭從看漲轉向看跌,交易者將其視為出售所持股份的信號。
Confirming the bearish trend, its negative directional index (red) was positioned above its positive index (green) at press time. The intersection occurred on 12th April, and these lines have maintained this position.
截至發稿時,其負向指數(紅色)位於正向指數(綠色)上方,證實了看跌趨勢。交叉點發生在4月12日,這些線路一直保持在這個位置。
This suggests that DOGE sellers have regained market control and are causing a price decline. It is a bearish signal that hints at a potential further downward movement.
這表明 DOGE 賣家已重新獲得市場控制權並導致價格下跌。這是一個看跌訊號,暗示可能進一步下跌。
Regarding demand for the meme coin, its Chaikin Money Flow (CMF) — which tracks the flow of money into and out of an asset — returned a negative value.
關於 meme 幣的需求,它的 Chaikin 資金流 (CMF)——追蹤資產進出的資金流量——返回了負值。
Realistic or not, here’s DOGE’s market cap in BTC’s terms
不管現實與否,這是 DOGE 以 BTC 計算的市值
A CMF value below zero indicates market weakness, as it suggests increased liquidity exit.
CMF 值低於零表示市場疲軟,因為它表明流動性退出增加。
At press time, DOGE’s CMF was -0.01.
截至發稿時,DOGE 的 CMF 為-0.01。
下一篇:比特幣減半後卡爾達諾的價格可能會讓你大吃一驚——以下是如何分享推文


 Crypto Daily™
 ETHNews
 Coin Edition
 DogeHome
 Crypto Daily™
 BlockchainReporter
 Crypto Daily™
 Crypto Daily™
 crypto.news


