- Dogecoin records growth in the last month amid the meme market decline.
- The gains may be wiped off soon, as key indicators showed that the bears remain in market control.
Dogecoin [DOGE] is the only leading meme coin to post gains in the last month, as meme coin market activity witnessed a decline, IntoTheBlock noted in a post on X (formerly Twitter).
ドージコインは、ミーム市場が下落する中、先月の成長を記録しました。弱気派が引き続き市場を支配していることを主要指標が示したため、この利益はすぐに消えてしまう可能性があります。ドージコイン[DOGE]は、先月利益を記録した唯一の有力なミームコインです。 、ミームコイン市場の活動が衰退を目撃したため、IntoTheBlockはX(以前のTwitter)への投稿で指摘しました。
According to the on-chain data provider, DOGE’s price climbed by 4.43% during the 30-day period.
オンチェーンデータプロバイダーによると、DOGEの価格は30日間で4.43%上昇した。
During this window period, the values of other leading assets, such as Pepe [PEPE] and Shiba Inu [SHIB], plunged by 33% and 25.28%, respectively.
この窓期間中に、ペペ [PEPE] や柴犬 [SHIB] などの他の主要資産の価値は、それぞれ 33% と 25.28% 下落しました。
Can DOGE extend these gains?
DOGE traded at $0.15 at press time. According to CoinMarketCap’s data, the meme coin’s price recorded a 6% price decline in the past 24 hours, mirroring the general market decline.
DOGE はこれらの利益をさらに拡大できるでしょうか?記事執筆時点では DOGE は 0.15 ドルで取引されていました。 CoinMarketCapのデータによると、ミームコインの価格は過去24時間で6%の価格下落を記録し、市場全体の下落を反映している。
Data from CoinGecko showed that the global cryptocurrency market capitalization dropped by 2.38% during the same period.
CoinGeckoのデータによると、同じ期間に世界の仮想通貨時価総額は2.38%減少した。
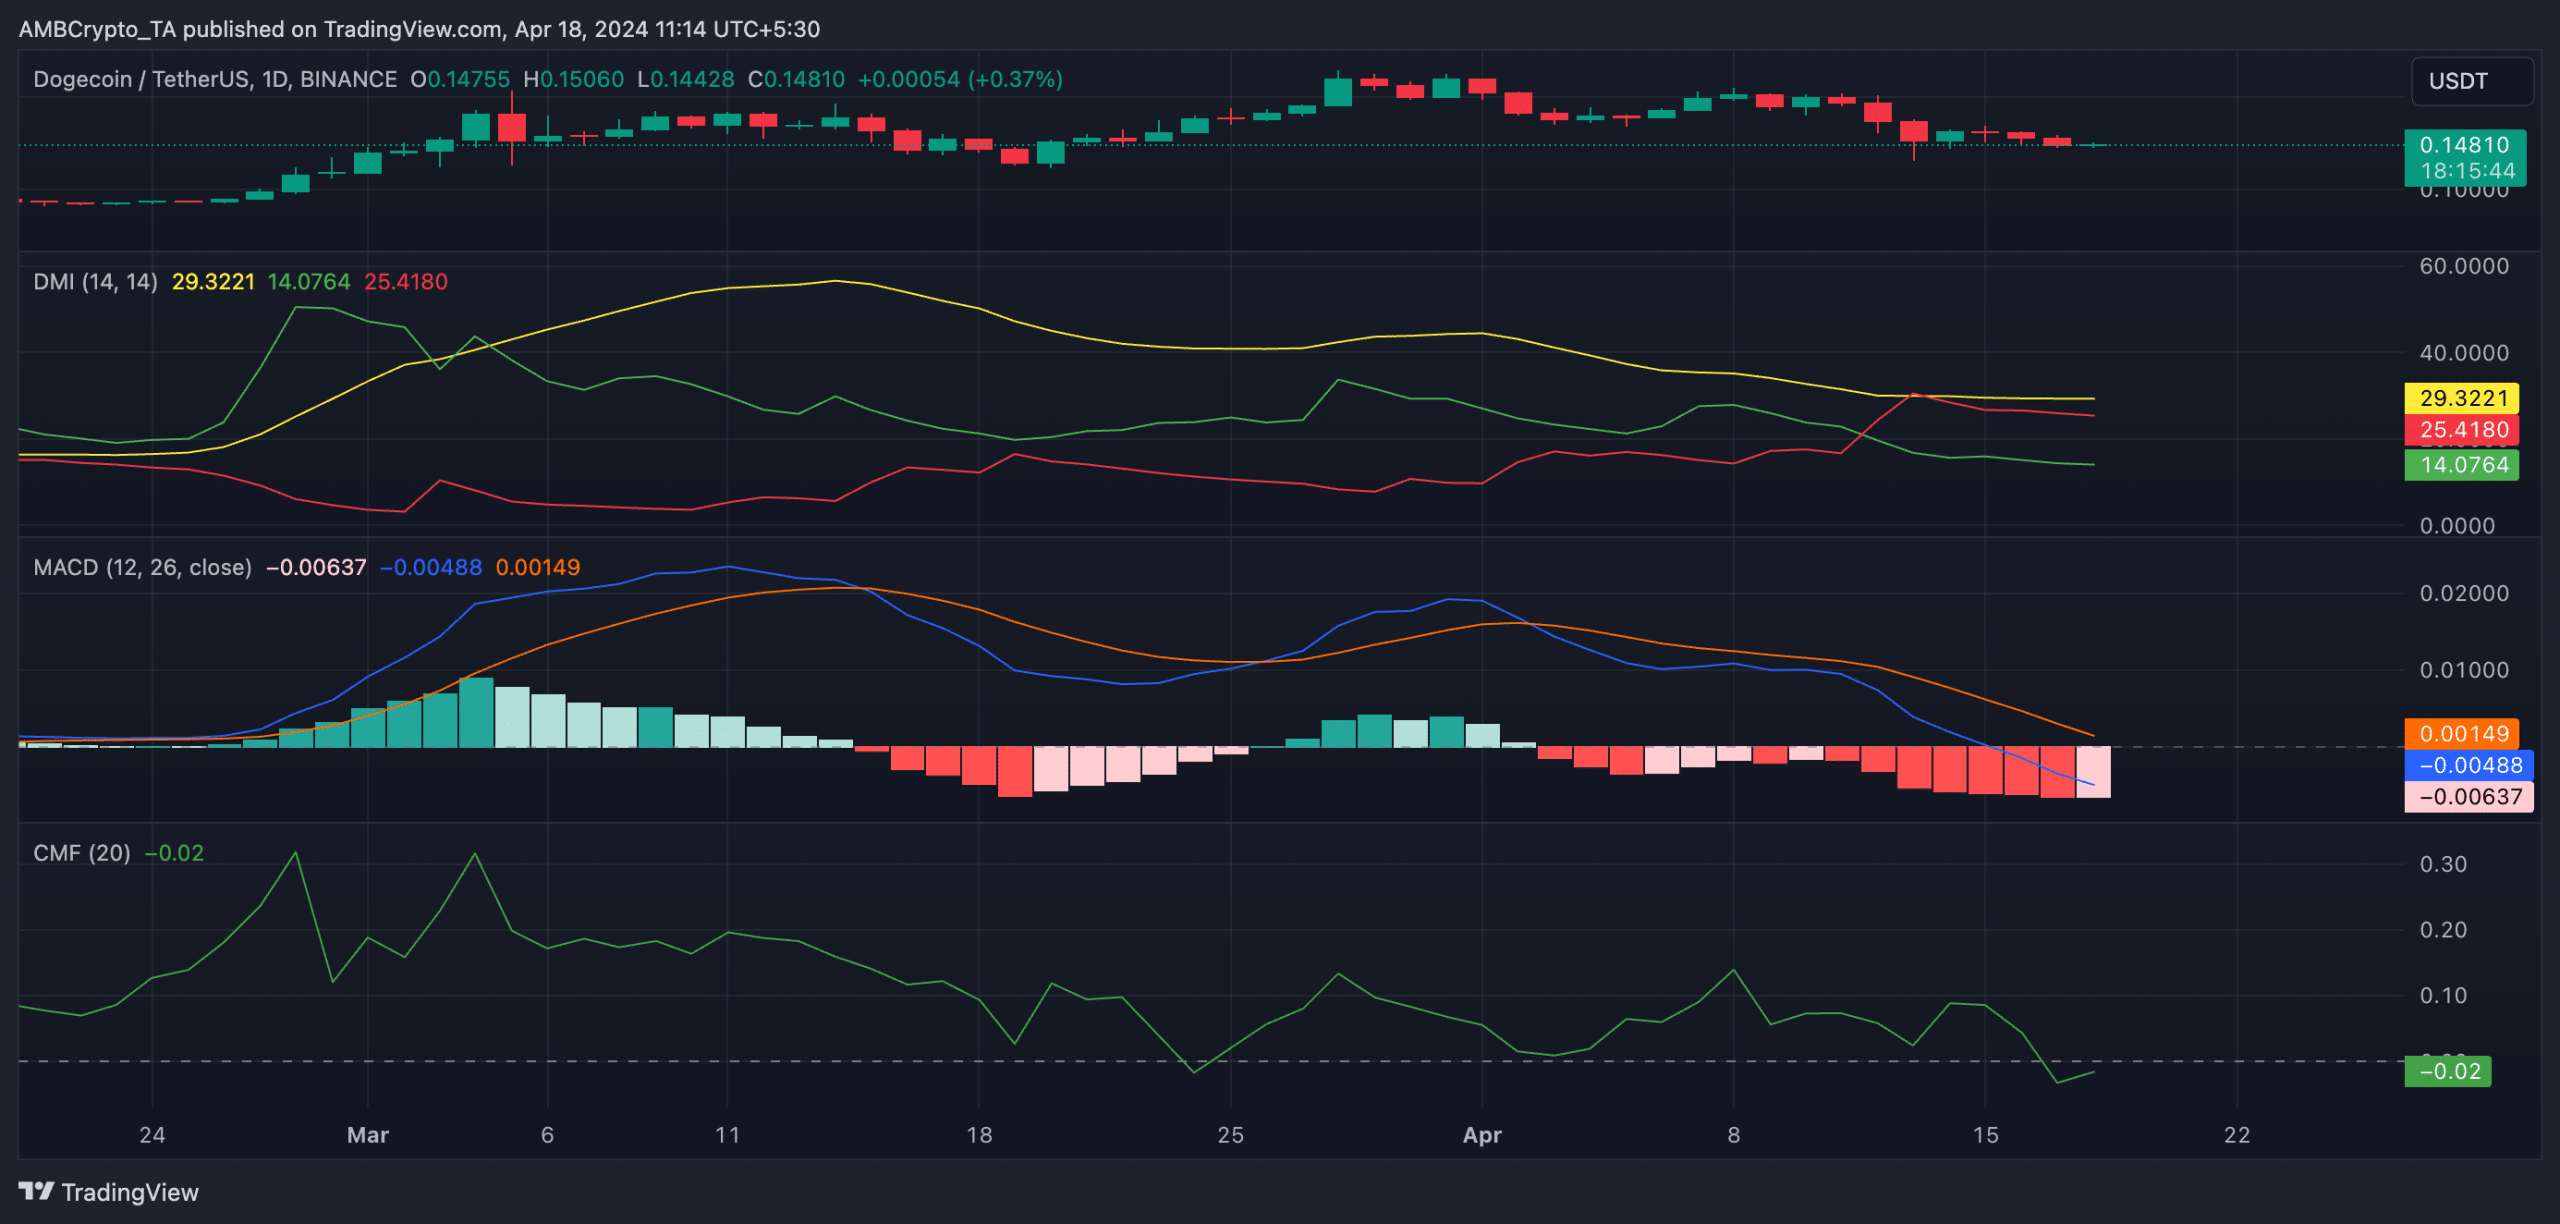
In assessing whether DOGE would extend its 30-day gains, AMBCrypto assessed its key technical indicators on a 1-day chart and discovered that bearish sentiments remained significant.
DOGEが30日間の上昇幅を拡大するかどうかを評価する際、AMBCryptoは主要なテクニカル指標を1日チャートで評価し、依然として弱気のセンチメントが顕著であることを発見した。
For example, readings from its Moving Average Convergence Divergence (MACD) indicator showed its MACD line resting below its signal line. These lines have been positioned this way since 2nd April.
たとえば、移動平均コンバージェンスダイバージェンス(MACD)インジケーターの読み取り値は、MACD ラインがシグナルラインの下にあることを示しました。これらの路線は 4 月 2 日からこのように配置されています。
When an asset’s MACD line falls below its signal line, its small moving average is below its longer-term moving average.
資産の MACD ラインがシグナルラインを下回ると、その小規模移動平均は長期移動平均を下回ります。
It often signals a shift in momentum from bullish to bearish, and traders take it as a sign to sell their holdings.
これは強気から弱気への勢いの変化を示すことが多く、トレーダーはこれを保有株を売却するサインとみなします。
Confirming the bearish trend, its negative directional index (red) was positioned above its positive index (green) at press time. The intersection occurred on 12th April, and these lines have maintained this position.
弱気傾向を裏付けるように、この記事の執筆時点では、負の方向性指数 (赤) が正の指数 (緑) よりも上に位置していました。交差点は 4 月 12 日に発生し、これらの路線はこの位置を維持しています。
This suggests that DOGE sellers have regained market control and are causing a price decline. It is a bearish signal that hints at a potential further downward movement.
これは、DOGEの売り手が市場のコントロールを取り戻し、価格下落を引き起こしていることを示唆しています。これはさらなる下落の可能性を示唆する弱気のシグナルです。
Regarding demand for the meme coin, its Chaikin Money Flow (CMF) — which tracks the flow of money into and out of an asset — returned a negative value.
ミームコインの需要に関しては、資産に出入りするお金の流れを追跡するチャイキンマネーフロー(CMF)がマイナスの値を返した。
Realistic or not, here’s DOGE’s market cap in BTC’s terms
Realistic or not, here’s DOGE’s market cap in BTC’s terms
A CMF value below zero indicates market weakness, as it suggests increased liquidity exit.
CMF 値がゼロを下回ると、流動性エグジットの増加を示唆するため、市場の弱さを示します。
At press time, DOGE’s CMF was -0.01.
記事執筆時点では、DOGE の CMF は -0.01 でした。
次へ: ビットコインの半減期後のカルダノの価格はあなたを驚かせるかもしれません – ShareShareTweet の方法は次のとおりです


 Crypto Daily™
 ETHNews
 Coin Edition
 DogeHome
 Crypto Daily™
 BlockchainReporter
 Crypto Daily™
 Crypto Daily™
 crypto.news


