

The Dogecoin (DOGE) price trades in a long-term corrective pattern and a short-term bearish one.
狗狗幣(DOGE)價格以長期修正模式和短期看跌模式進行交易。
DOGE has returned to a horizontal support area that has existed since the start of the year. Will it bounce or break down?
DOGE 已回到今年年初以來一直存在的水平支撐區域。它會反彈還是破裂?
Dogecoin Falls After Rejection
狗狗幣被拒絕後下跌
The technical analysis of the daily time frame shows that the DOGE price has fallen since reaching a high of $0.107 on December 11, 2023. The downward movement caused a decrease inside an ascending parallel channel that had existed since June 2023.
每日時間框架的技術分析顯示,DOGE 價格自 2023 年 12 月 11 日達到 0.107 美元的高點以來一直在下跌。下跌趨勢導致自 2023 年 6 月以來一直存在的上昇平行通道內下跌。
While Dogecoin bounced at the pattern’s midline, it was rejected by the resistance trend line twice (red icons) on January 11 and 21, 2024, respectively. DOGE now trades close to the channel’s midline again.
雖然狗狗幣在該形態的中線反彈,但它分別於 2024 年 1 月 11 日和 21 日兩次被阻力趨勢線(紅色圖示)拒絕。 DOGE 現在再次接近通道中線。
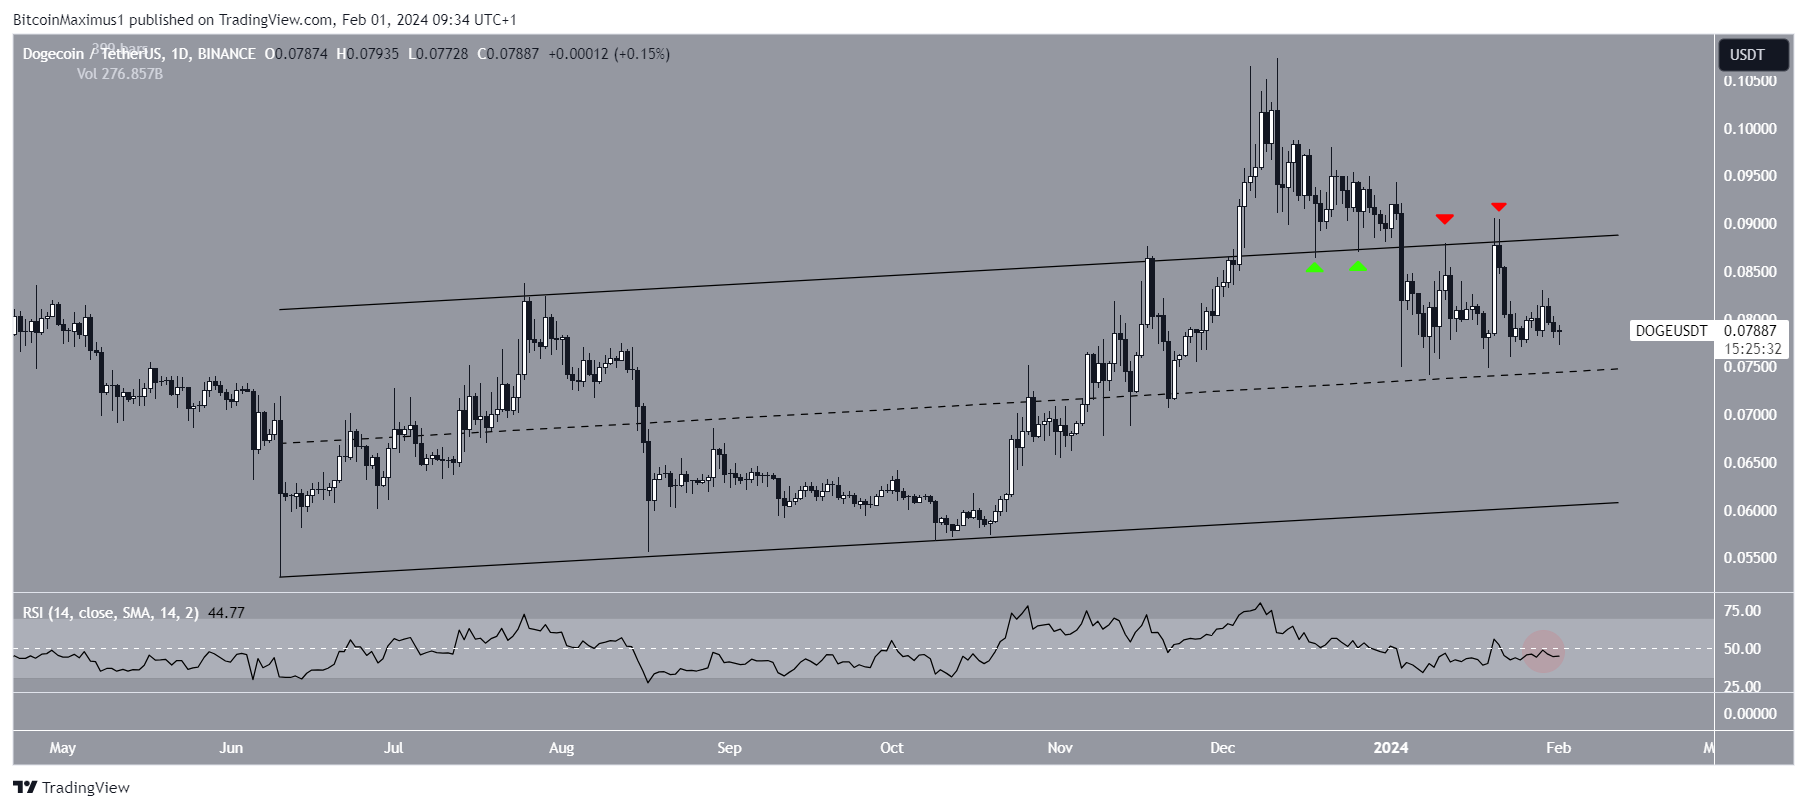
DOGE/USDT 每日圖表。來源:TradingView
The daily Relative Strength Index (RSI) gives a bearish reading. The RSI is a momentum indicator traders use to evaluate whether a market is overbought or oversold and whether to accumulate or sell an asset.
每日相對強弱指數(RSI)給出看跌讀數。 RSI 是交易者用來評估市場是否超買或超賣以及是否累積或出售資產的動量指標。
Readings above 50 and an upward trend suggest that bulls still have an advantage, while readings below 50 indicate the opposite. The indicator is below 50 (red circle), a sign of a bearish trend.
讀數高於 50 且呈上升趨勢表示多頭仍具有優勢,而讀數低於 50 則表示相反。該指標低於 50(紅圈),這是看跌趨勢的標誌。
Read More: Dogecoin vs. Bitcoin: An Ultimate Comparison
了解更多:狗狗幣與比特幣:終極比較
DOGE Price Prediction: Will Price Break Down From Bearish Pattern?
DOGE 價格預測:價格會從看跌模式中突破嗎?
The six-hour time frame technical analysis shows that DOGE has fallen under a descending resistance trend line since December 2023. When combined with the $0.077 horizontal support area, this created a descending triangle, considered a bearish pattern.
六小時時間框架技術分析顯示,自 2023 年 12 月以來,DOGE 已跌至下降阻力趨勢線下方。與 0.077 美元水平支撐區域結合,形成了一個下降三角形,被視為看跌模式。
Read More: How to Buy Dogecoin (DOGE) Anonymously
了解更多:如何匿名購買狗狗幣 (DOGE)
The DOGE price trades just above this support area, while the RSI has fallen below 50 (red circle). If it breaks down, DOGE can drop by 27% to the closest support area at $0.057.
DOGE 價格交投於該支撐區域上方,而 RSI 已跌破 50(紅色圓圈)。如果跌破,DOGE 可能會下跌 27%,至最近的支撐位 0.057 美元。
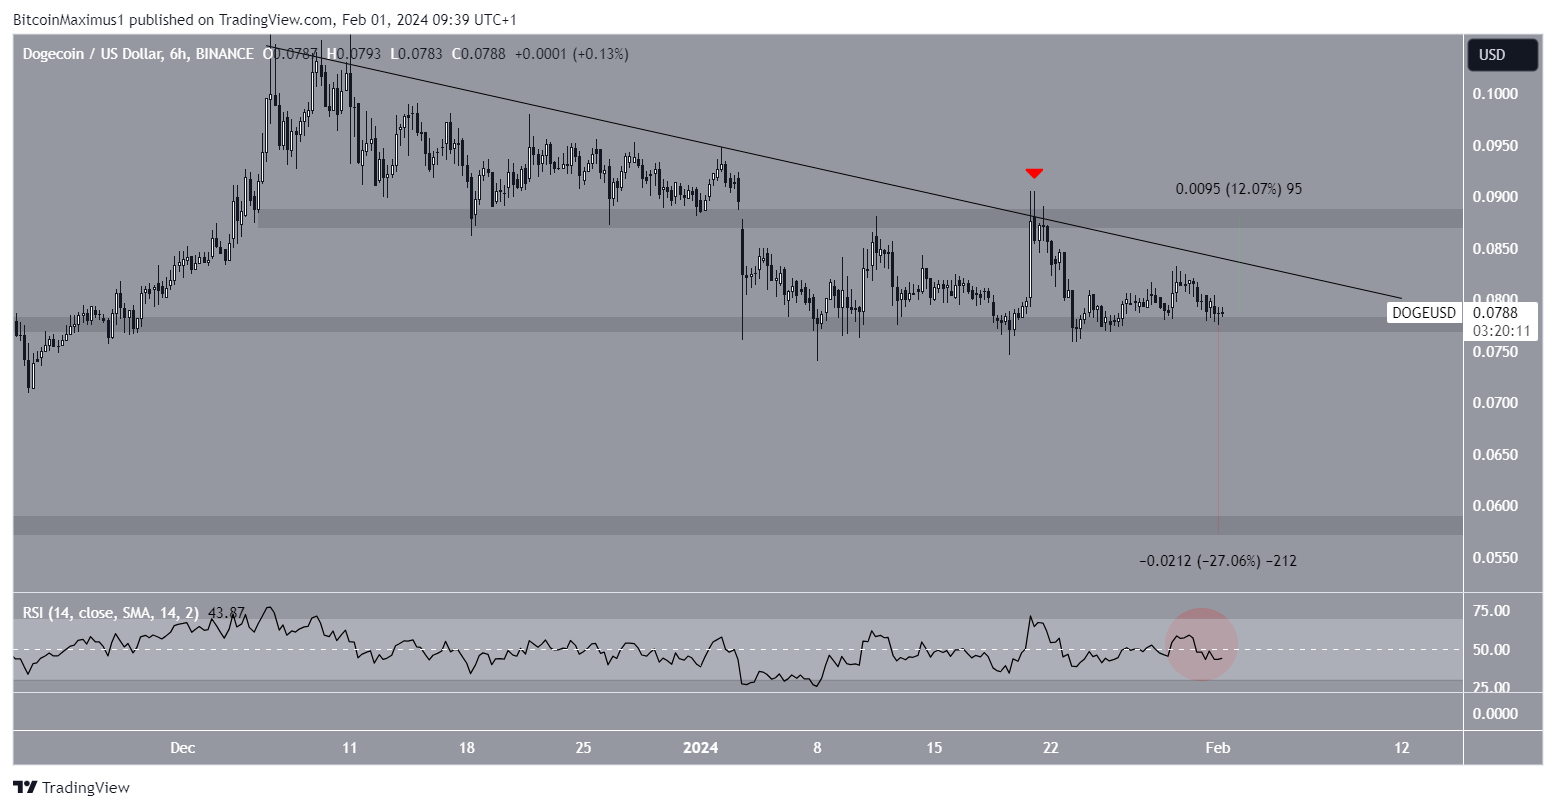
DOGE/USDT 六小時圖。來源:TradingView
Despite the bearish Dogecoin price prediction, a strong bounce at the $0.077 area can trigger a breakout from the resistance trend line and a 12% increase to the next resistance at $0.087.
儘管狗狗幣價格預測看跌,但 0.077 美元區域的強勁反彈可能會觸發阻力趨勢線的突破,並上漲 12% 至下一個阻力位 0.087 美元。
For BeInCrypto‘s latest crypto market analysis, click here
如需 BeInCrypto 的最新加密貨幣市場分析,請點擊此處
美國頂級加密貨幣平台 | 2024 年 2 月


Disclaimer
免責聲明
In line with the Trust Project guidelines, this price analysis article is for informational purposes only and should not be considered financial or investment advice. BeInCrypto is committed to accurate, unbiased reporting, but market conditions are subject to change without notice. Always conduct your own research and consult with a professional before making any financial decisions. Please note that our Terms and Conditions, Privacy Policy, and Disclaimers have been updated.
根據信託項目指南,本價格分析文章僅供參考,不應被視為財務或投資建議。 BeInCrypto 致力於提供準確、公正的報告,但市場狀況如有變更,恕不另行通知。在做出任何財務決定之前,請務必進行自己的研究並諮詢專業人士。請注意,我們的條款和條件、隱私權政策和免責聲明已更新。
 DogeHome
 Cryptopolitan_News
 Coin Edition
 BlockchainReporter
 crypto.news
 Crypto Daily™
 BlockchainReporter
 Optimisus


