

Dogecoin (DOGE) Price Analysis: A Bullish Breakout?
Dogecoin(Doge)價格分析:看漲的突破?
Dogecoin experienced a significant price surge, increasing 10.6% to reach $0.2042. This upward movement encountered potential resistance at $0.2087. A decisive break above this resistance level could signal a shift in market sentiment and accelerate further price increases. Sustained price action within the $0.18-$0.19 support range would be crucial for this upward momentum to continue. Further gains could push the price towards the $0.21-$0.22 range.
Dogecoin的價格高漲,增加了10.6%,達到0.2042美元。 這種向上的移動遇到了0.2087美元的潛在阻力。 高於此阻力水平的決定性突破可能表明市場情緒的轉變,並加速進一步的價格上漲。 在$ 0.18- $ 0.19的支持範圍內持續的價格行動對於這種向上的勢頭至關重要。 進一步的收益可能會將價格推向0.21- $ 0.22的範圍。
Market speculation surrounding Dogecoin's future price is growing, fueled by historical patterns suggesting substantial growth potential for 2025. A key driver for this anticipated rise is the expected availability of Dogecoin exchange-traded funds (ETFs). Following regulatory approvals for Bitcoin and Ethereum-based ETFs, investors anticipate similar approval for a DOGE ETF, adding to the growing number of crypto-related financial products.
圍繞Dogecoin未來價格的市場猜測正在增長,這表明歷史模式表明2025年的巨大增長潛力。這一預期上升的主要驅動力是Dogecoin Exchange貿易資金(ETF)的預期可用性。 經過對基於比特幣和以太坊的ETF的監管批准,投資者預計對Doge ETF獲得了類似的批准,從而增加了與加密相關的金融產品的越來越多。
Dogecoin's recent surge to $0.2042 represents a 10.6% increase over the past 24 hours. This significant price jump indicates strong bullish market conditions and increased investor interest. 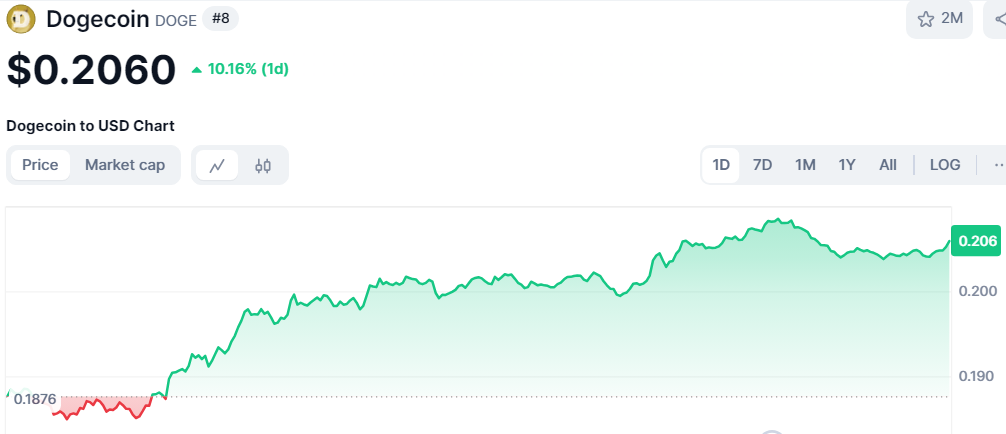
Dogecoin最近的增長到0.2042美元,在過去24小時內增長了10.6%。 這種巨大的價格上漲表明了強烈的看漲市場狀況並增加了投資者的興趣。
Source: Coinmarketcap
資料來源:CoinMarketCap
Over the past 24 hours, DOGE fluctuated between $0.1847 and $0.2087, demonstrating considerable price movement. The current price sits near its daily high, suggesting buyer dominance and a potential continuation of upward momentum.
在過去的24小時內,Doge波動在0.1847美元至0.2087美元之間,表明價格很大。 目前的價格位於每日高處,這表明買方的統治地位和潛在的向上勢頭延續。
Technical Analysis: Bullish Signals Emerge
技術分析:看漲信號出現
The Dogecoin 4-hour chart shows a Relative Strength Index (RSI) breakout, indicating a potential shift in market direction. A previous downward trend in the RSI reflected bearish pressure. The recent upward break suggests weakening selling pressure and strengthening buying pressure.
Dogecoin 4小時圖表顯示了相對強度指數(RSI)的突破,表明市場方向的潛在轉變。 RSI的先前下降趨勢反映了看跌壓力。 最近的上斷表明銷售壓力減弱和加強購買壓力。
The current price chart displays a descending trendline resistance. A successful break above this trendline would confirm a shift from bearish to bullish market conditions. Key resistance levels lie between $0.21 and $0.22, while support remains at $0.18 to $0.19. A successful breakout could trigger a strong upward rally, although short-term consolidation or minor pullbacks are possible before further price adjustments.
當前的價格圖顯示了降級趨勢線阻力。 超越此趨勢線的成功突破將證實從看跌向看漲的市場狀況的轉變。 關鍵阻力水平在0.21美元至0.22美元之間,而支持仍為0.18美元至0.19美元。 成功的突破可能會引發強烈的向上集會,儘管在進一步調整之前,短期合併或輕微的回調可能會引起。
 Thecoinrepublic.com
 DogeHome
 Thecoinrepublic.com
 Crypto Daily™


