

Dogecoin (DOGE) Price Analysis: A Bullish Breakout?
Dogecoin(Doge)価格分析:強気なブレイクアウト?
Dogecoin experienced a significant price surge, increasing 10.6% to reach $0.2042. This upward movement encountered potential resistance at $0.2087. A decisive break above this resistance level could signal a shift in market sentiment and accelerate further price increases. Sustained price action within the $0.18-$0.19 support range would be crucial for this upward momentum to continue. Further gains could push the price towards the $0.21-$0.22 range.
Dogecoinは大幅な価格の急増を経験し、10.6%増加して0.2042ドルに達しました。 この上向きの動きは、0.2087ドルで潜在的な抵抗に遭遇しました。 この抵抗レベルを上回る決定的な休憩は、市場の感情の変化を示す可能性があり、さらなる価格の上昇を加速させる可能性があります。 0.18ドルから0.19ドルのサポート範囲内での持続的な価格アクションは、この上向きの勢いを継続するために重要です。 さらに利益は、価格を0.21〜0.22ドルの範囲に押し上げる可能性があります。
Market speculation surrounding Dogecoin's future price is growing, fueled by historical patterns suggesting substantial growth potential for 2025. A key driver for this anticipated rise is the expected availability of Dogecoin exchange-traded funds (ETFs). Following regulatory approvals for Bitcoin and Ethereum-based ETFs, investors anticipate similar approval for a DOGE ETF, adding to the growing number of crypto-related financial products.
Dogecoinの将来の価格を取り巻く市場の推測は、2025年の大幅な成長の可能性を示唆する歴史的パターンに支えられており、この予想される上昇の重要な推進力は、Dogecoin Exchange-Traded Funds(ETF)の予想される可用性です。 ビットコインとイーサリアムベースのETFの規制当局の承認に続いて、投資家はDoge ETFの同様の承認を予測し、暗号関連の金融商品の数が増えています。
Dogecoin's recent surge to $0.2042 represents a 10.6% increase over the past 24 hours. This significant price jump indicates strong bullish market conditions and increased investor interest. 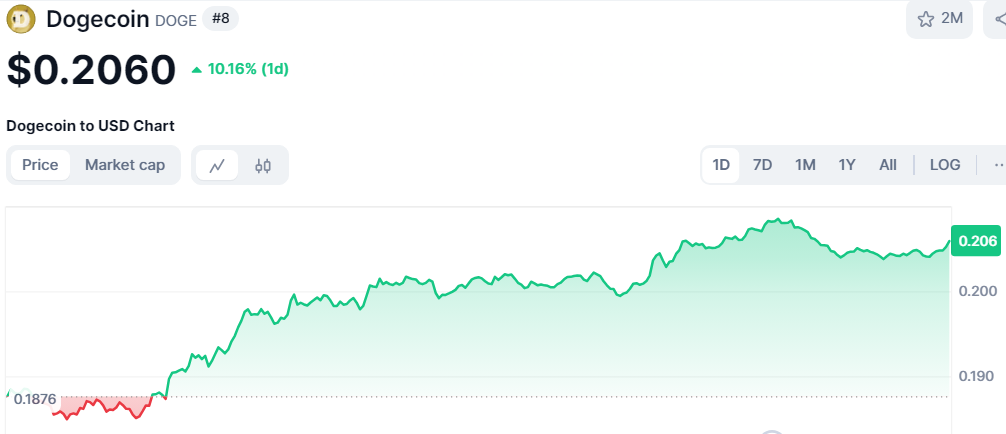
Dogecoinの最近の0.2042ドルへの急増は、過去24時間で10.6%の増加を表しています。 この重要な価格上昇は、強い強気市場の状況と投資家の関心の向上を示しています。
Source: Coinmarketcap
出典:CoinMarketCap
Over the past 24 hours, DOGE fluctuated between $0.1847 and $0.2087, demonstrating considerable price movement. The current price sits near its daily high, suggesting buyer dominance and a potential continuation of upward momentum.
過去24時間にわたって、Dogeは0.1847ドルから0.2087ドルの間で変動し、かなりの価格の動きを示しました。 現在の価格は毎日の高値の近くにあり、買い手の優位性と上向きの勢いの潜在的な継続を示唆しています。
Technical Analysis: Bullish Signals Emerge
テクニカル分析:強気信号が出現します
The Dogecoin 4-hour chart shows a Relative Strength Index (RSI) breakout, indicating a potential shift in market direction. A previous downward trend in the RSI reflected bearish pressure. The recent upward break suggests weakening selling pressure and strengthening buying pressure.
Dogecoin 4時間チャートは、相対強度指数(RSI)ブレイクアウトを示しており、市場方向の潜在的な変化を示しています。 RSIの以前の下降傾向は、弱気圧力を反映しています。 最近の上向きの休憩は、販売圧力を弱め、買いの圧力を強化することを示唆しています。
The current price chart displays a descending trendline resistance. A successful break above this trendline would confirm a shift from bearish to bullish market conditions. Key resistance levels lie between $0.21 and $0.22, while support remains at $0.18 to $0.19. A successful breakout could trigger a strong upward rally, although short-term consolidation or minor pullbacks are possible before further price adjustments.
現在の価格チャートには、下降傾向のトレンドライン抵抗が表示されます。 このトレンドラインを上回る成功した休憩は、弱気から強気の市場状況への移行を確認するでしょう。 主要な抵抗レベルは0.21ドルから0.22ドルの間にありますが、サポートは0.18ドルから0.19ドルのままです。 ブレイクアウトが成功すると、強力な上昇ラリーがトリガーされる可能性がありますが、さらに価格調整前に短期の統合または軽微なプルバックが可能です。
 Thecoinrepublic.com
 DogeHome
 Thecoinrepublic.com
 Crypto Daily™


