

Dogecoin's Monthly Chart Shows a Doji Candle, Mirroring Past Price Movements
Dogecoin的每月圖表顯示了DOJI蠟燭,反映了過去的價格動作
Dogecoin's latest monthly chart displays a Doji candle, a pattern historically preceding significant price fluctuations. This mirrors similar formations observed before previous notable upward trends in Dogecoin's price. Analysts are closely watching to see if this pattern will repeat, potentially leading to substantial price changes.
Dogecoin的最新每月圖表顯示了DOJI蠟燭,這是一種歷史上顯著的價格波動的模式。 這反映了在先前的Dogecoin價格上面顯著的向上趨勢之前觀察到的類似地層。 分析師正在仔細觀察,以查看這種模式是否會重複,有可能導致價格發生重大變化。
This Doji candle formation is reminiscent of the 2017-2018 cycle, where a similar pattern preceded a substantial increase in Dogecoin's value.
這種DOJI蠟燭的形成讓人聯想到2017 - 2018年周期,在這種情況下,類似的模式在狗狗的價值上大幅提高。
Understanding the Doji Formation
了解Doji編隊
A Doji candle signifies market indecision, characterized by nearly identical opening and closing prices. Historically, this has often foreshadowed trend reversals or periods of strong momentum. Dogecoin's current chart structure closely resembles past cycles that resulted in rapid price movements. Historical data suggests the potential for significant volatility following such formations.
DOJI蠟燭表示市場猶豫不決,其特點是幾乎相同的開盤和收盤價。 從歷史上看,這通常預示著趨勢逆轉或強勁勢頭的時期。 Dogecoin的當前圖表結構與過去的循環非常相似,這導致了價格快速變動。 歷史數據表明,在這種形成之後,有可能發生明顯的波動性。
Market observations reveal that a Doji candle preceded a significant price surge in 2017, following a consolidation phase. A similar pattern emerged in 2024 after a period of accumulation and upward movement. These breakouts, following periods of accumulation, were each preceded by a Doji candle and subsequently experienced bullish trends.
市場觀察結果表明,在合併階段,DOJI蠟燭在2017年的價格上漲之前。 一段時間後,在2024年出現了類似的模式。 這些突破在積累之後,每個都有DOJI蠟燭,隨後經歷了看漲趨勢。
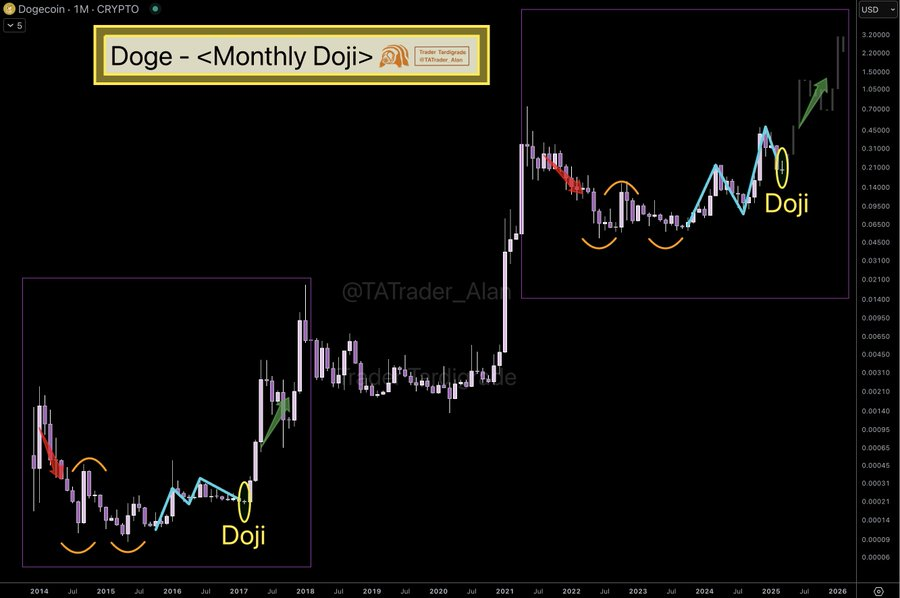
Source: Trader Tardigrade (X)
資料來源:Trader Tardigrade(X)
The chart also reveals previous downtrends, recoveries, and breakout levels. Historically, Doji candles have appeared at reversal points before major upward price trends.
該圖表還揭示了以前的下降趨勢,恢復和突破水平。 從歷史上看,Doji蠟燭在主要上漲趨勢之前出現在逆轉點上。
Current Market Conditions and Historical Parallels
當前的市場狀況和歷史相似之處
The 2017-2018 period saw a similar Doji pattern on Dogecoin's monthly chart, followed by an upward trend. Market participants are comparing the current market conditions to those of the past. The similarities in technical patterns have drawn considerable attention to Dogecoin's current market behavior. The coin's price movement aligns with historical data that previously indicated significant price changes.
2017-2018時期在Dogecoin的每月圖表上也有類似的Doji模式,隨後是向上的趨勢。市場參與者將當前的市場狀況與過去的市場條件進行比較。 技術模式的相似之處引起了人們對Dogecoin當前市場行為的極大關注。 硬幣的價格變動與以前表明價格發生重大變化的歷史數據保持一致。
While a Doji candle doesn't guarantee future price action, it highlights a point of market indecision. Traders and analysts are closely monitoring Dogecoin to see if history will repeat itself. The current pattern has sparked considerable discussion about the market's potential response.
雖然DOJI蠟燭不能保證未來的價格行動,但它突出了市場猶豫不決。貿易商和分析師正在密切監視Dogecoin,以查看歷史是否會重演。 當前的模式引發了有關市場潛在反應的大量討論。
 TheCoinrise Media
 TheCoinrise Media
 Crypto News Land
 DogeHome
 Cryptopolitan_News
 Cryptopolitan_News
 BlockchainReporter
 Optimisus


