

Dogecoin's Monthly Chart Shows a Doji Candle, Mirroring Past Price Movements
Dogecoinの毎月のチャートはDoji Candleを示しており、過去の価格の動きを反映しています
Dogecoin's latest monthly chart displays a Doji candle, a pattern historically preceding significant price fluctuations. This mirrors similar formations observed before previous notable upward trends in Dogecoin's price. Analysts are closely watching to see if this pattern will repeat, potentially leading to substantial price changes.
Dogecoinの最新の月次チャートには、歴史的に重要な価格変動に先行するパターンであるDoji Candleが表示されます。 これは、Dogecoinの価格の以前の顕著な上昇傾向の前に観察された同様の層を反映しています。 アナリストは、このパターンが繰り返されるかどうかを確認するために注意深く見ており、潜在的に大幅な価格の変化につながる。
This Doji candle formation is reminiscent of the 2017-2018 cycle, where a similar pattern preceded a substantial increase in Dogecoin's value.
このDoji Candle Formationは、2017年から2018年のサイクルを連想させます。このサイクルでは、同様のパターンがDogecoinの価値の大幅な増加に先行していました。
Understanding the Doji Formation
doji層を理解する
A Doji candle signifies market indecision, characterized by nearly identical opening and closing prices. Historically, this has often foreshadowed trend reversals or periods of strong momentum. Dogecoin's current chart structure closely resembles past cycles that resulted in rapid price movements. Historical data suggests the potential for significant volatility following such formations.
dojiのろうそくは、ほぼ同一の開設と終値を特徴とする市場の優柔不断を意味します。 歴史的に、これはしばしばトレンドの逆転または強い勢いの期間を予見してきました。 Dogecoinの現在のチャート構造は、急速な価格の動きをもたらす過去のサイクルに非常に似ています。 履歴データは、そのような形成後の著しいボラティリティの可能性を示唆しています。
Market observations reveal that a Doji candle preceded a significant price surge in 2017, following a consolidation phase. A similar pattern emerged in 2024 after a period of accumulation and upward movement. These breakouts, following periods of accumulation, were each preceded by a Doji candle and subsequently experienced bullish trends.
市場の観察は、統合段階に続いて、2017年にDojiのろうそくが大幅に価格の急増に先行することを明らかにしています。 同様のパターンは、蓄積と上向きの動きの期間の後、2024年に現れました。 これらのブレイクアウトは、蓄積の期間に続いて、それぞれがdojiのろうそくに先行し、その後強気の傾向を経験しました。
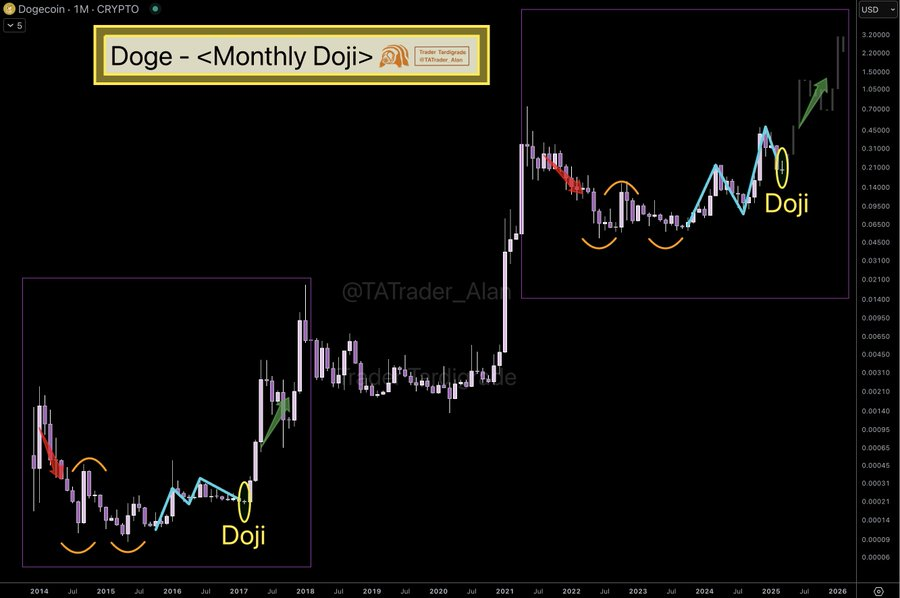
Source: Trader Tardigrade (X)
出典:Trader Tardigrade(x)
The chart also reveals previous downtrends, recoveries, and breakout levels. Historically, Doji candles have appeared at reversal points before major upward price trends.
チャートでは、以前の下降トレンド、回復、ブレイクアウトレベルも明らかになります。 歴史的に、dojiキャンドルは、大きな上昇価格の動向の前に反転地点に登場しています。
Current Market Conditions and Historical Parallels
現在の市場の状況と歴史的な類似点
The 2017-2018 period saw a similar Doji pattern on Dogecoin's monthly chart, followed by an upward trend. Market participants are comparing the current market conditions to those of the past. The similarities in technical patterns have drawn considerable attention to Dogecoin's current market behavior. The coin's price movement aligns with historical data that previously indicated significant price changes.
2017-2018期間には、Dogecoinの月間チャートで同様のDojiパターンがあり、その後に上昇傾向がありました。市場参加者は、現在の市場の状況を過去の市場条件と比較しています。 技術的なパターンの類似点は、Dogecoinの現在の市場行動にかなりの注目を集めています。 コインの価格移動は、以前に大幅な価格の変化を示していた履歴データと一致しています。
While a Doji candle doesn't guarantee future price action, it highlights a point of market indecision. Traders and analysts are closely monitoring Dogecoin to see if history will repeat itself. The current pattern has sparked considerable discussion about the market's potential response.
dojiキャンドルは将来の価格アクションを保証するものではありませんが、市場の優柔不断を強調しています。トレーダーとアナリストは、DogeCoinを綿密に監視して、歴史が繰り返されるかどうかを確認しています。 現在のパターンは、市場の潜在的な対応についてかなりの議論を引き起こしました。
 TheCoinrise Media
 TheCoinrise Media
 Crypto News Land
 DogeHome
 Cryptopolitan_News
 Cryptopolitan_News
 BlockchainReporter
 Optimisus


