

Dogecoin Price Analysis: Dragonfly Doji Suggests Potential Reversal
Dogecoin價格分析:Dragonfly Doji建議潛在的逆轉
Recent Dogecoin (DOGE) price action shows a Dragonfly Doji forming on the daily chart, potentially signaling a reversal of the current downtrend. At the time of writing, DOGE was trading at $0.19, with the $0.20 level acting as a potential support.
最近的Dogecoin(Doge)價格動作顯示了每日圖表上形成的蜻蜓Doji,這可能表明當前下降趨勢的逆轉。 在撰寫本文時,Doge的交易價格為0.19美元,0.20美元的水平是潛在的支持。
This Doji formed at the bottom of a declining market structure, following a drop from approximately $0.235 to a low of $0.199. The long lower wick indicates strong buying pressure at lower levels, preventing further decline and suggesting a potential shift in momentum.
這種DOJI在市場結構下降的底部形成,此前下降了大約0.235美元降至0.199美元的低點。長較低的燈芯表明在較低水平的購買壓力很大,防止了進一步的下降,並暗示了動量的潛在轉變。
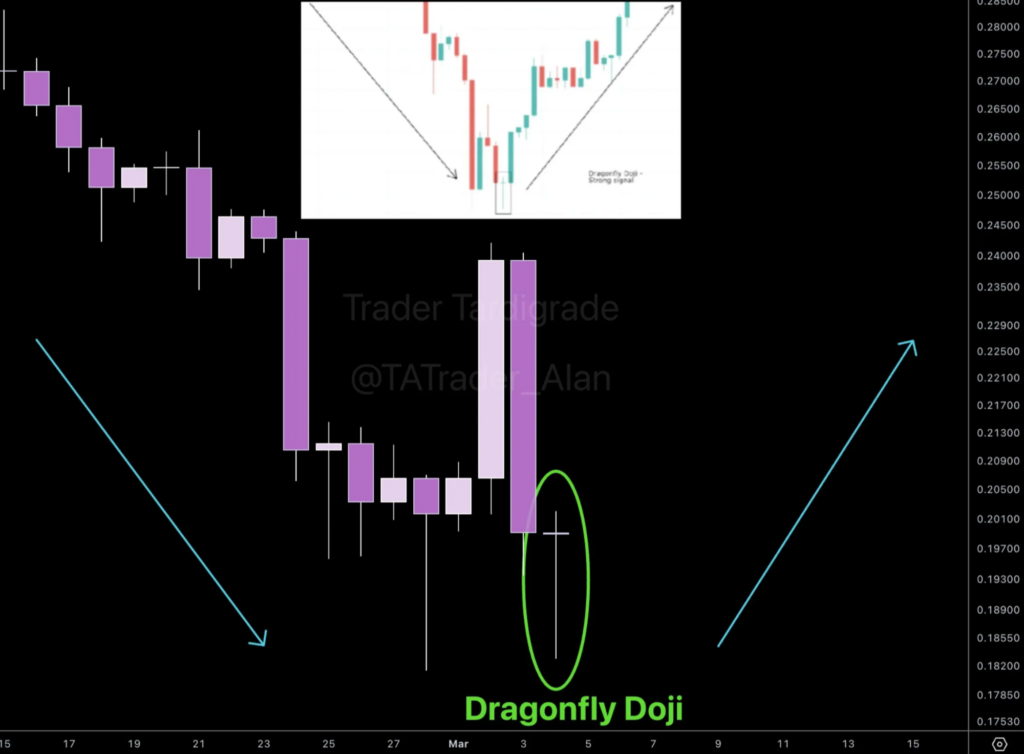
DOGE Daily Chart | Source: Trader Tardigrade/X
Doge每日圖表|資料來源:Trader Tardigrade/X
A bullish confirmation could see DOGE reclaim $0.21 as immediate resistance, with further upside potential towards $0.225 and $0.235. A close above these levels would strongly suggest a trend reversal. However, a failure to maintain buying pressure could lead to a retest of $0.178 before testing the next key support around $0.165. Failure to hold above $0.19 would weaken the reversal signal and increase the likelihood of further downside.
看漲的確認可以將Doge收回0.21 $ 0.21,這是立即的阻力,其上漲潛力為0.225美元和0.235美元。 超過這些水平的接近將強烈暗示趨勢逆轉。但是,未能保持購買壓力可能會導致重新測試0.178美元,然後再測試下一個鑰匙支架左右,約為0.165美元。 不超過$ 0.19會削弱逆轉信號,並增加進一步弊端的可能性。
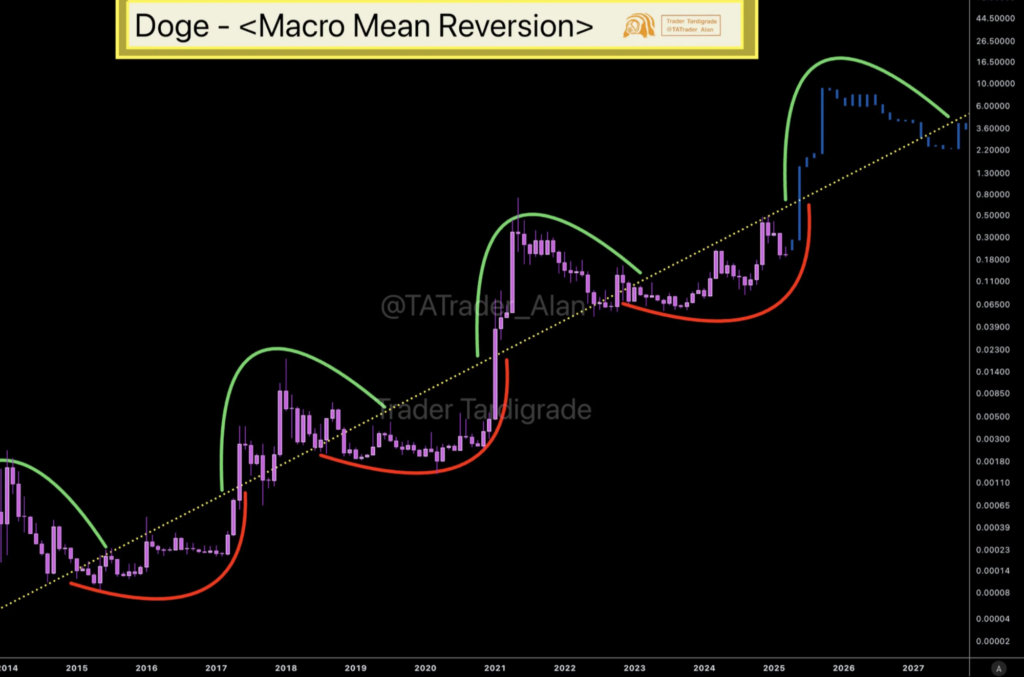
Mean Reversion Analysis
平均歸還分析
The mean reversion theory suggests that DOGE's price tends to revert to its historical average over time. Approaching this average could signal either a continuation of an uptrend or the beginning of a downturn. Currently, DOGE is in a downtrend. Historically, crossings above this average have been associated with increased buying activity and investor interest. However, failure to reach or falling away from this average could confirm a bearish market shift. Nearing the mean could present buying opportunities, while falling below it could indicate a longer-term decline.
平均歸還理論表明,隨著時間的流逝,Doge的價格往往會恢復其歷史平均水平。 接近這一平均水平可能會表明上升趨勢的延續或低迷的開始。目前,Doge處於下降趨勢。從歷史上看,超過該平均水平的交叉與購買活動和投資者的利益增加有關。 但是,未能到達或脫離這個平均水平可能會證實看跌市場的轉變。 接近平均值可能會帶來購買機會,而落在它之下的同時可能表明長期下降。
Whale Activity Surge
鯨魚活動激增
Recent Dogecoin news highlights a significant increase in DOGE holdings by whales, with approximately 180 million DOGE accumulated over the last 24 hours. This accumulation is reflected in distinct peaks on the trading volume chart, showing periods of heavy buying activity. The most pronounced peak occurred between the end of February and the beginning of March.
最近的Dogecoin新聞重點介紹了鯨魚的總門因持有量的大幅增長,在過去的24小時內,大約1.8億多迪格累積了。這種累積反映在交易量圖表上的不同峰值中,顯示了重型購買活動的時期。最明顯的高峰發生在2月底至3月初。
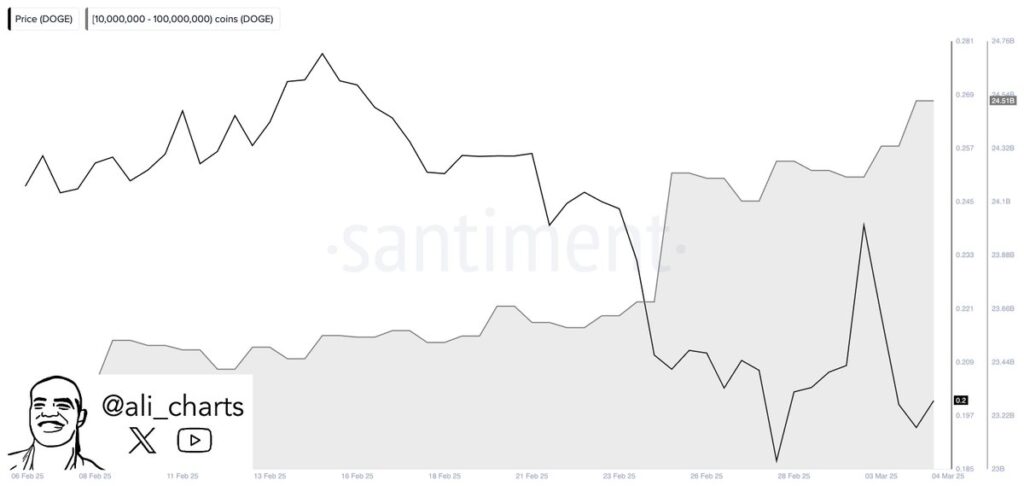
DOGE Whale Activity | Source: Ali Charts/X
大門鯨活動|資料來源:Ali圖表/X
Historically, large-scale whale buying can lead to short-term price increases due to perceived undervaluation. This can attract smaller investors, further driving the price up. Conversely, large-scale selling by whales could trigger a sharp price drop and panic selling. Traders should monitor whale activity for potential market shifts.
從歷史上看,大規模的鯨魚購買可能會導致由於缺乏評價而導致短期價格上漲。這可以吸引較小的投資者,進一步推動價格上漲。相反,鯨魚的大規模銷售可能會引發急劇的價格下跌和恐慌銷售。 交易者應監視鯨魚活動以進行潛在的市場轉變。
This analysis was originally published on The Coin Republic.
該分析最初發表在硬幣共和國。
 The Coin Republic
 BlockchainReporter
 TheCoinrise Media
 BlockchainReporter
 DogeHome
 CFN
CFN Cointelegraph
 CFN
CFN


