

Dogecoin Price Analysis: Dragonfly Doji Suggests Potential Reversal
Dogecoin価格分析:Dragonfly Dojiは潜在的な逆転を提案しています
Recent Dogecoin (DOGE) price action shows a Dragonfly Doji forming on the daily chart, potentially signaling a reversal of the current downtrend. At the time of writing, DOGE was trading at $0.19, with the $0.20 level acting as a potential support.
最近のDogeCoin(Doge)の価格アクションは、毎日のチャートにドラゴンフライドジが形成されていることを示しており、現在の下降トレンドの逆転を示す可能性があります。 執筆時点では、Dogeは0.19ドルで取引されており、0.20ドルのレベルが潜在的なサポートとして機能していました。
This Doji formed at the bottom of a declining market structure, following a drop from approximately $0.235 to a low of $0.199. The long lower wick indicates strong buying pressure at lower levels, preventing further decline and suggesting a potential shift in momentum.
このdojiは、約0.235ドルから最低$ 0.199に減少した後、減少する市場構造の底に形成されました。長い低い芯は、より低いレベルでの強い購入圧力を示しており、さらなる減少を防ぎ、勢いの潜在的な変化を示唆しています。
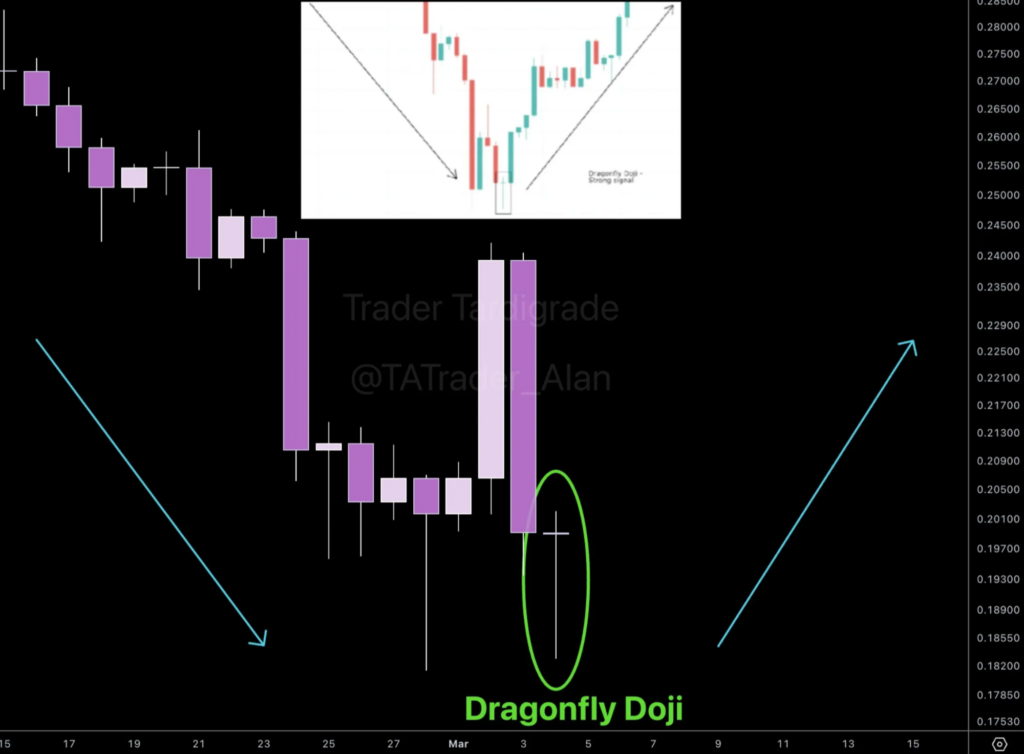
DOGE Daily Chart | Source: Trader Tardigrade/X
Doge Daily Chart |出典:Trader Tardigrade/x
A bullish confirmation could see DOGE reclaim $0.21 as immediate resistance, with further upside potential towards $0.225 and $0.235. A close above these levels would strongly suggest a trend reversal. However, a failure to maintain buying pressure could lead to a retest of $0.178 before testing the next key support around $0.165. Failure to hold above $0.19 would weaken the reversal signal and increase the likelihood of further downside.
強気の確認により、Dogeは0.21ドルを即時の抵抗として再生する可能性があり、さらに0.225ドルと0.235ドルに向かう可能性があります。 これらのレベルを上回ると、傾向の逆転が強く示唆されます。ただし、購入プレッシャーを維持できなかったため、次のキーサポートを0.165ドル前後にテストする前に、0.178ドルの再テストにつながる可能性があります。 0.19ドルを超えて保持しないと、反転信号が弱まり、さらにダウンサイドの可能性が高まります。
Mean Reversion Analysis
平均復帰分析
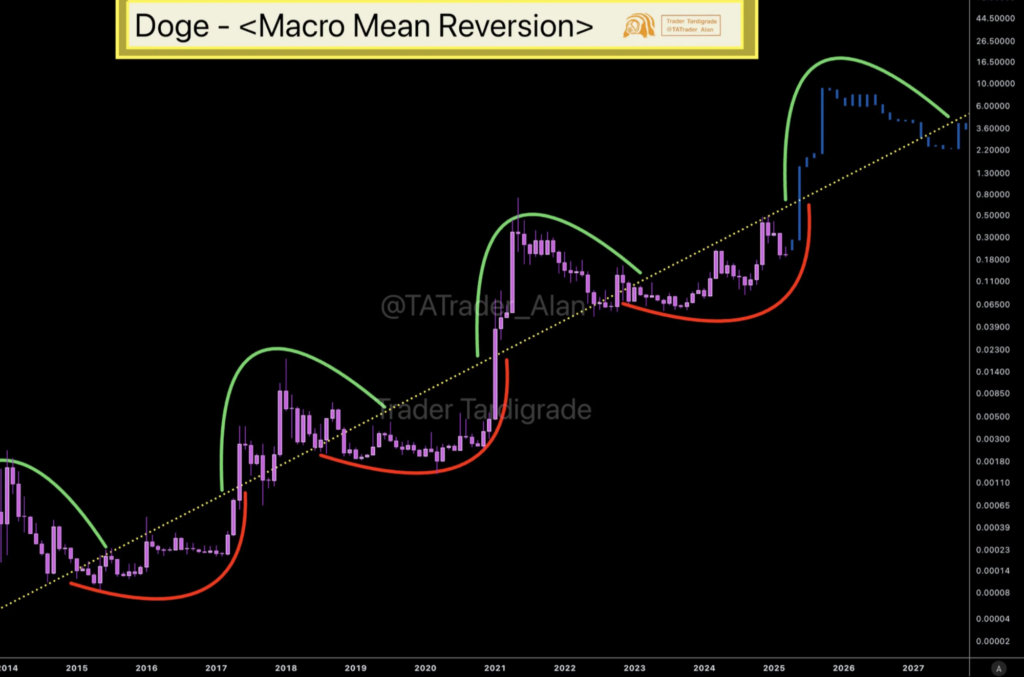
The mean reversion theory suggests that DOGE's price tends to revert to its historical average over time. Approaching this average could signal either a continuation of an uptrend or the beginning of a downturn. Currently, DOGE is in a downtrend. Historically, crossings above this average have been associated with increased buying activity and investor interest. However, failure to reach or falling away from this average could confirm a bearish market shift. Nearing the mean could present buying opportunities, while falling below it could indicate a longer-term decline.
平均復帰理論は、Dogeの価格が時間の経過とともに歴史的平均に戻る傾向があることを示唆しています。 この平均に近づくと、上昇トレンドの継続または景気後退の開始のいずれかを示す可能性があります。現在、Dogeは洞窟にあります。歴史的に、この平均を超える交差は、購入活動の増加と投資家の関心に関連しています。 ただし、この平均から到達したり、脱落したりすると、弱気な市場の変化が確認される可能性があります。 平均に近づくと、購入の機会が提示される可能性がありますが、それを下回ると、長期的な減少を示す可能性があります。
Whale Activity Surge
クジラの活動の急増
Recent Dogecoin news highlights a significant increase in DOGE holdings by whales, with approximately 180 million DOGE accumulated over the last 24 hours. This accumulation is reflected in distinct peaks on the trading volume chart, showing periods of heavy buying activity. The most pronounced peak occurred between the end of February and the beginning of March.
最近のDogecoin Newsは、クジラによるDoge Holdingsの大幅な増加を強調しており、過去24時間で約1億8000万人のDogeが蓄積しています。この蓄積は、トレーディングボリュームチャートの明確なピークに反映されており、大量の購入活動の期間を示しています。最も顕著なピークは、2月末から3月の初めの間に発生しました。
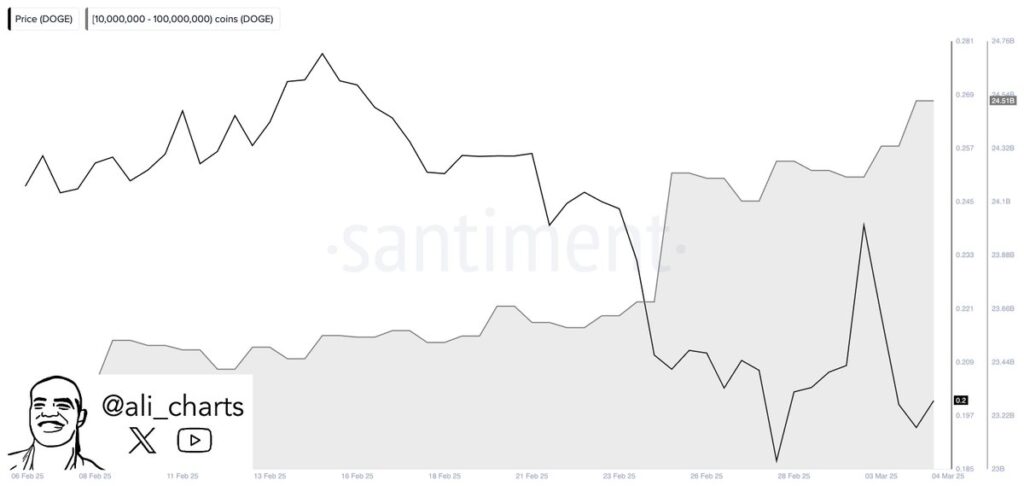
DOGE Whale Activity | Source: Ali Charts/X
ドージクジラの活動|出典:Ali Charts/X
Historically, large-scale whale buying can lead to short-term price increases due to perceived undervaluation. This can attract smaller investors, further driving the price up. Conversely, large-scale selling by whales could trigger a sharp price drop and panic selling. Traders should monitor whale activity for potential market shifts.
歴史的に、大規模なクジラの購入は、過小評価のために短期的な価格上昇につながる可能性があります。これは、より小さな投資家を引き付けることができ、価格をさらに高めることができます。逆に、クジラによる大規模な販売は、急激な価格の下落とパニック販売を引き起こす可能性があります。 トレーダーは、潜在的な市場シフトのためにクジラの活動を監視する必要があります。
This analysis was originally published on The Coin Republic.
この分析はもともとコイン共和国で公開されました。
 The Coin Republic
 BlockchainReporter
 TheCoinrise Media
 BlockchainReporter
 DogeHome
 CFN
CFN Cointelegraph
 CFN
CFN


