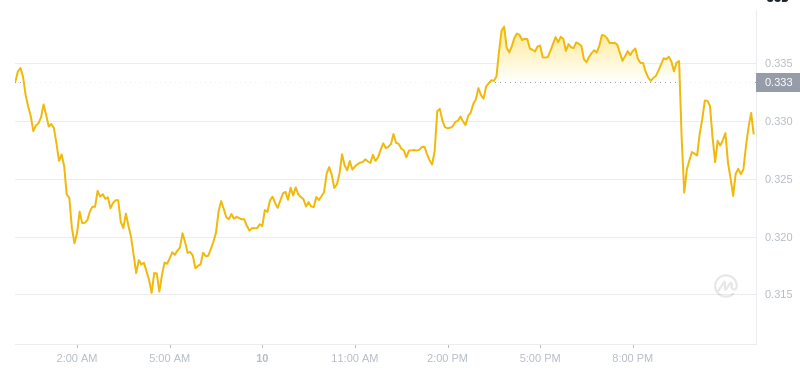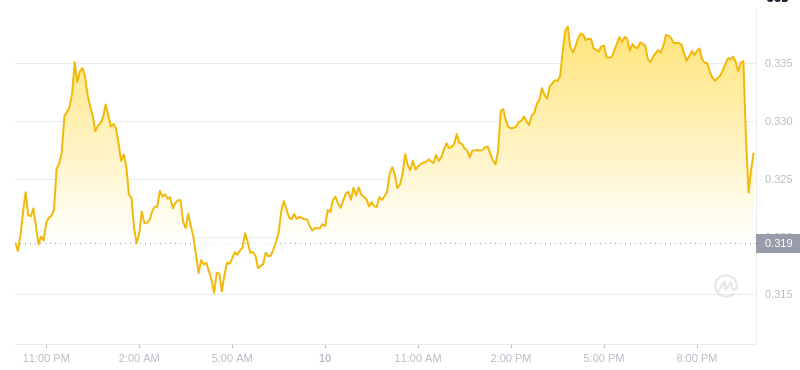
Dogecoin Price Plummets by Over 15%
狗狗幣價格暴跌超過 15%
Dogecoin has experienced a significant decline, falling below the $0.1150 level against the US Dollar. It currently trades below $0.100, exhibiting bearish signals.
狗狗幣兌美元匯率大幅下跌,跌破 0.1150 美元水準。目前其交易價格低於 0.100 美元,顯示出看跌訊號。
The price has dropped over 15% from its previous peak above $0.1200. It now trades below both the $0.100 level and the 100-hourly simple moving average.
價格較之前 0.1200 美元上方的峰值下跌了 15% 以上。目前其交易價格均低於 0.100 美元水準和 100 小時簡單移動平均線。
A bearish trend line has formed on the hourly chart of the DOGE/USD pair with resistance at $0.1000. Unless this resistance is reclaimed, the price is likely to continue its downward trajectory.
DOGE/USD 貨幣對的小時圖上已形成看跌趨勢線,阻力位為 0.1000 美元。除非重新突破該阻力位,否則價格可能會繼續下行。
Dogecoin Consolidates Losses
狗狗幣鞏固損失
In recent sessions, Dogecoin has paralleled the price declines of Bitcoin and Ethereum. Bears have taken control, pushing the price below support levels at $0.1120 and $0.1050.
最近幾個交易日,狗狗幣的價格下跌與比特幣和以太坊的價格同步下跌。空頭佔據了主導地位,將價格推低至支撐位 0.1120 美元和 0.1050 美元。
It even dipped below $0.1000, reaching a low of $0.0881. Dogecoin is currently consolidating its losses.
它甚至跌破 0.1000 美元,觸及 0.0881 美元的低點。狗狗幣目前正在鞏固其損失。
The price shows bearish indicators below the 23.6% Fib retracement level of its downward move from $0.1194 to $0.0881.
價格顯示出看跌指標,低於其從 0.1194 美元跌至 0.0881 美元的 23.6% Fib 回檔位。
Trading beneath $0.100 and the 100-hourly simple moving average, Dogecoin faces immediate resistance at $0.0950 and major resistance at $0.1000.
狗狗幣交投於 0.100 美元和 100 小時簡單移動平均線下方,面臨 0.0950 美元的直接阻力和 0.1000 美元的主要阻力。
A breakout above $0.100 could lead to a rally towards $0.1040 or the 50% Fib retracement level at $0.1080, with $0.1120 serving as a potential upside target.
突破 0.100 美元可能導致反彈至 0.1040 美元或 0.1080 美元的 50% Fib 回撤位,其中 0.1120 美元作為潛在的上行目標。
Potential Downsides
潛在的缺點
If Dogecoin fails to regain $0.1000, it may enter another decline. Initial support is at $0.0880, followed by $0.0850.
如果狗狗幣未能重回0.1000美元,則可能會進入另一次下跌。初步支撐位為 0.0880 美元,隨後為 0.0850 美元。
The main support level lies at $0.0780. A breach below this level could lead to further losses towards $0.0720.
主要支撐位為 0.0780 美元。跌破該水準可能會導致進一步損失至 0.0720 美元。
Technical Indicators
技術指標
- Hourly MACD: Gaining momentum in the bearish zone.
- Hourly RSI: Below the 50 level.
- Major Support Levels: $0.0880, $0.0780
- Major Resistance Levels: $0.0950, $0.1000
每小時 MACD:在看跌區域中獲得動力。


 DogeHome
 Bitcoin Sistemi EN
 CoinPedia News
 ETHNews
 Crypto Daily™
 DogeHome
 crypto.news
 BTC Peers
 BlockchainReporter


