

Dogecoin's Long-Term Resilience: Fibonacci Levels and Channel Stability
Dogecoin的長期彈性:斐波那契水平和渠道穩定性
Technical analysis using Fibonacci retracement and extension levels, alongside rising channel dynamics, helps illuminate Dogecoin's potential future price trajectory. Past accumulation zones within these channels provide valuable insights.
使用斐波那契回回和擴展水平的技術分析,以及上升的通道動力學,有助於闡明多黴素的潛在未來價格軌跡。 這些渠道中的過去積累區提供了寶貴的見解。
Long-term channel dynamics reveal consistent support for Dogecoin since 2015, with historical price behavior offering a guide to current market stability. The current price near $0.1717 suggests Dogecoin is testing mid-channel support, potentially setting the stage for a move towards higher Fibonacci targets.
自2015年以來,長期的渠道動態揭示了對Dogecoin的一致支持,歷史價格行為為當前市場穩定提供了指南。 目前的價格接近0.1717美元,表明Dogecoin正在測試中通道支持,有可能為朝著更高的斐波那契目標邁進奠定基礎。
On March 12, 2025, experts analyzed Dogecoin's long-term price performance using logarithmic charts and technical analysis, focusing on support levels, Fibonacci tools, and channel dynamics.
2025年3月12日,專家使用對數圖表和技術分析分析了Dogecoin的長期價格績效,重點是支持水平,斐波那契工具和渠道動力學。
Long-Term Channel Dynamics
長期渠道動力學
A recent tweet by crypto analyst Ali Martinez on X highlighted Dogecoin holding a key support level within its long-term channel, reflecting established technical trends and channel behavior. This aligns with broader analysis of historical price movements.
加密分析師阿里·馬丁內斯(Ali Martinez)最近在X上發了一條推文,該推文強調了狗狗幣在其長期渠道內擁有關鍵支持水平,這反映了既定的技術趨勢和渠道行為。這與對歷史價格變動的更廣泛分析相吻合。
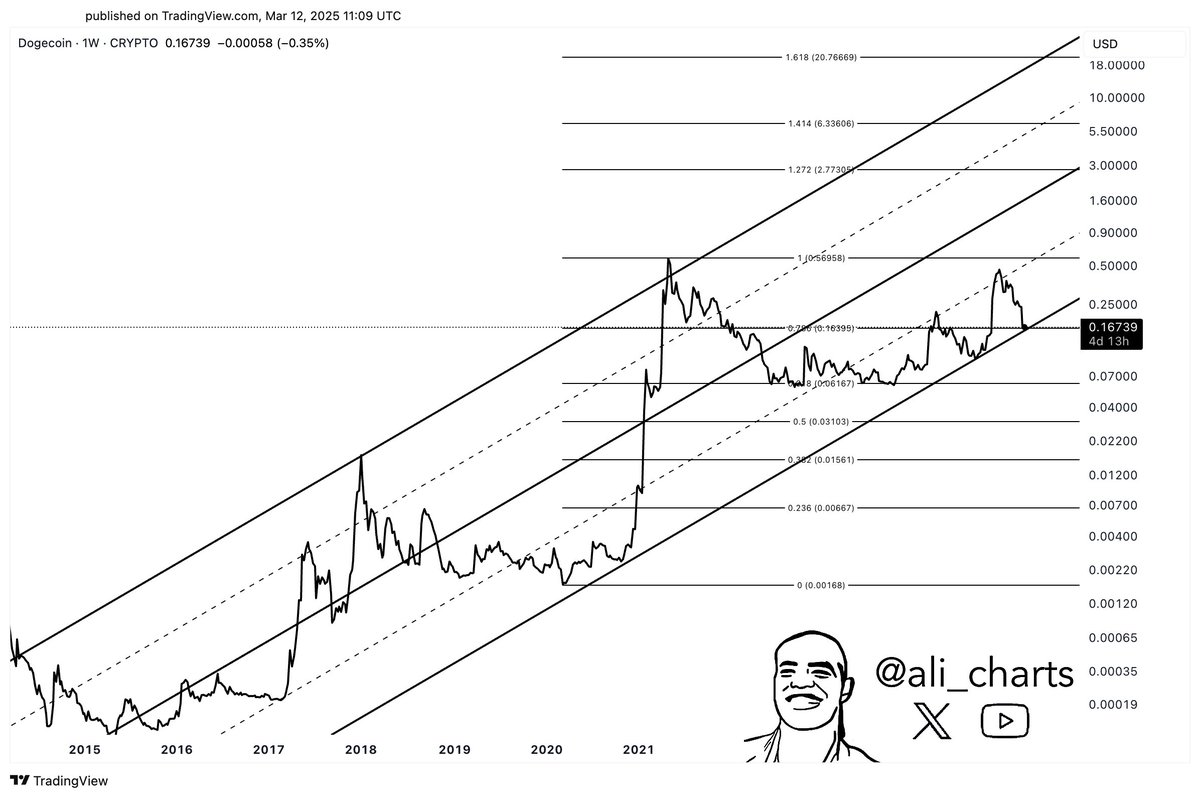
Source: Ali Charts
資料來源:Ali圖表
Dogecoin has maintained a rising channel since 2015. Its lower boundary has consistently acted as reliable support, reinforcing price stability, while the upper boundary has historically coincided with peak market rallies. Analysts observe that historical bull and bear cycles within this channel have shown strong rallies followed by moderate corrections.
Dogecoin自2015年以來一直保持著上升的渠道。其下邊界一直充當可靠的支持,增強價格穩定性,而上邊界歷史上與峰值市場集會相吻合。分析人士觀察到,該渠道中的歷史牛和熊週期顯示了強烈的集會,然後進行了適度的校正。
Fibonacci Analysis and Support Levels
斐波那契分析和支持水平
Significant accumulation zones are marked by Fibonacci retracement levels (0.236, 0.382, and 0.5), historically defining support and resistance. Charts show these levels were active before previous price surges. Furthermore, higher Fibonacci extension levels (1.272, 1.414, and 1.618) suggest potential upward targets if momentum resumes.
顯著的積累區以斐波那契反回的水平(0.236、0.382和0.5)標記,歷史上定義了支撐和耐藥性。 圖表顯示,在先前的價格飆升之前,這些水平是活躍的。 此外,較高的斐波那契擴展水平(1.272、1.414和1.618)表明,如果恢復動量,則可能會向上靶標。
The 1.0 Fibonacci level, representing Dogecoin's previous all-time high near $1.05, is considered a critical resistance area. The structure provided by Fibonacci tools helps understand market reactions to historical support and resistance zones.
1.0斐波那契水平,代表Dogecoin以前的歷史高度接近1.05美元,被認為是關鍵的阻力區域。 斐波那契工具提供的結構有助於了解市場對歷史支持和阻力區的反應。
Market Update and Future Outlook
市場更新和未來前景
At press time, Dogecoin trades near $0.1717, close to a key mid-channel support level. Price stability here could lead to a retest of higher zones, potentially around $0.25. However, a break below this level might trigger a return to lower Fibonacci retracement areas between $0.03 and $0.06.
發稿時,Dogecoin的交易價格接近0.1717美元,接近渠道中的關鍵支持水平。 這裡的價格穩定可能會導致更高區域的重新測試,可能約為0.25美元。 但是,低於此級別的休息可能會觸發返回較低的斐波那契回回面積在0.03美元至0.06美元之間。
Technical analysis suggests two potential scenarios for Dogecoin's future: a gradual price recovery towards $0.50 and $1.00, or a pullback if current support fails. This analysis offers a balanced perspective consistent with Dogecoin's historical performance.
技術分析表明,Dogecoin的未來有兩個潛在的方案:逐漸恢復到0.50美元和1.00美元,或者如果當前支持失敗,則可以回調。 該分析提供了與Dogecoin歷史表現一致的平衡觀點。
 DogeHome
 Cointelegraph
 The Coin Republic
 Optimisus
 Coin_Gabbar
 Crypto News Land
 Crypto Front News
 Crypto Daily™


