

Dogecoin's Long-Term Resilience: Fibonacci Levels and Channel Stability
Dogecoin的长期弹性:斐波那契水平和渠道稳定性
Technical analysis using Fibonacci retracement and extension levels, alongside rising channel dynamics, helps illuminate Dogecoin's potential future price trajectory. Past accumulation zones within these channels provide valuable insights.
使用斐波那契回回和扩展水平的技术分析,以及上升的通道动力学,有助于阐明多霉素的潜在未来价格轨迹。 这些渠道中的过去积累区提供了宝贵的见解。
Long-term channel dynamics reveal consistent support for Dogecoin since 2015, with historical price behavior offering a guide to current market stability. The current price near $0.1717 suggests Dogecoin is testing mid-channel support, potentially setting the stage for a move towards higher Fibonacci targets.
自2015年以来,长期的渠道动态揭示了对Dogecoin的一致支持,历史价格行为为当前市场稳定提供了指南。 目前的价格接近0.1717美元,表明Dogecoin正在测试中通道支持,有可能为朝着更高的斐波那契目标迈进奠定基础。
On March 12, 2025, experts analyzed Dogecoin's long-term price performance using logarithmic charts and technical analysis, focusing on support levels, Fibonacci tools, and channel dynamics.
2025年3月12日,专家使用对数图表和技术分析分析了Dogecoin的长期价格绩效,重点是支持水平,斐波那契工具和渠道动力学。
Long-Term Channel Dynamics
长期渠道动力学
A recent tweet by crypto analyst Ali Martinez on X highlighted Dogecoin holding a key support level within its long-term channel, reflecting established technical trends and channel behavior. This aligns with broader analysis of historical price movements.
加密分析师阿里·马丁内斯(Ali Martinez)最近在X上发了一条推文,该推文强调了狗狗币在其长期渠道内拥有关键支持水平,这反映了既定的技术趋势和渠道行为。这与对历史价格变动的更广泛分析相吻合。
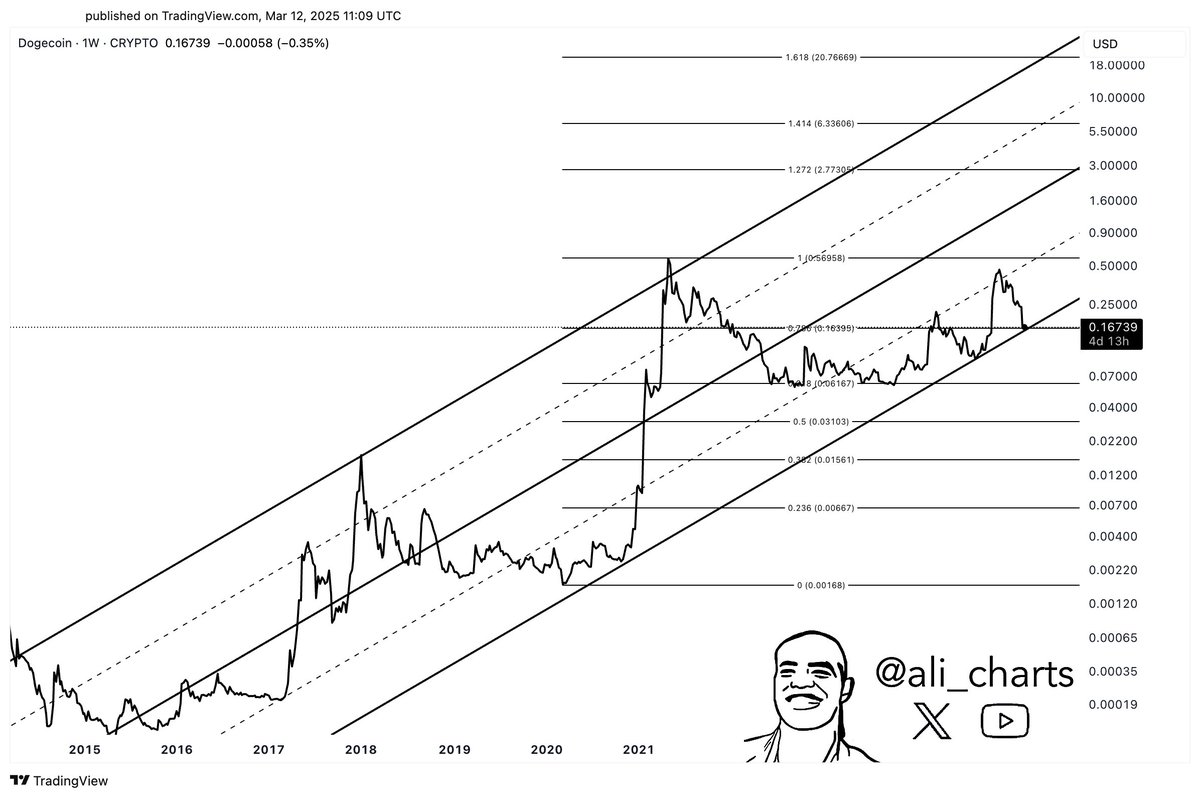
Source: Ali Charts
资料来源:Ali图表
Dogecoin has maintained a rising channel since 2015. Its lower boundary has consistently acted as reliable support, reinforcing price stability, while the upper boundary has historically coincided with peak market rallies. Analysts observe that historical bull and bear cycles within this channel have shown strong rallies followed by moderate corrections.
Dogecoin自2015年以来一直保持着上升的渠道。其下边界一直充当可靠的支持,增强价格稳定性,而上边界历史上与峰值市场集会相吻合。分析人士观察到,该渠道中的历史牛和熊周期显示了强烈的集会,然后进行了适度的校正。
Fibonacci Analysis and Support Levels
斐波那契分析和支持水平
Significant accumulation zones are marked by Fibonacci retracement levels (0.236, 0.382, and 0.5), historically defining support and resistance. Charts show these levels were active before previous price surges. Furthermore, higher Fibonacci extension levels (1.272, 1.414, and 1.618) suggest potential upward targets if momentum resumes.
显着的积累区以斐波那契反回的水平(0.236、0.382和0.5)标记,历史上定义了支撑和耐药性。 图表显示,在先前的价格飙升之前,这些水平是活跃的。 此外,较高的斐波那契扩展水平(1.272、1.414和1.618)表明,如果恢复动量,则可能会向上靶标。
The 1.0 Fibonacci level, representing Dogecoin's previous all-time high near $1.05, is considered a critical resistance area. The structure provided by Fibonacci tools helps understand market reactions to historical support and resistance zones.
1.0斐波那契水平,代表Dogecoin以前的历史高度接近1.05美元,被认为是关键的阻力区域。 斐波那契工具提供的结构有助于了解市场对历史支持和阻力区的反应。
Market Update and Future Outlook
市场更新和未来前景
At press time, Dogecoin trades near $0.1717, close to a key mid-channel support level. Price stability here could lead to a retest of higher zones, potentially around $0.25. However, a break below this level might trigger a return to lower Fibonacci retracement areas between $0.03 and $0.06.
发稿时,Dogecoin的交易价格接近0.1717美元,接近渠道中的关键支持水平。 这里的价格稳定可能会导致更高区域的重新测试,可能约为0.25美元。 但是,低于此级别的休息可能会触发返回较低的斐波那契回回面积在0.03美元至0.06美元之间。
Technical analysis suggests two potential scenarios for Dogecoin's future: a gradual price recovery towards $0.50 and $1.00, or a pullback if current support fails. This analysis offers a balanced perspective consistent with Dogecoin's historical performance.
技术分析表明,Dogecoin的未来有两个潜在的方案:逐渐恢复到0.50美元和1.00美元,或者如果当前支持失败,则可以回调。 该分析提供了与Dogecoin历史表现一致的平衡观点。
 DogeHome
 Cointelegraph
 The Coin Republic
 Optimisus
 Coin_Gabbar
 Crypto News Land
 Crypto Front News
 Crypto Daily™


