

Cover image via U.Today
通過U.Today掩護圖像
The cryptocurrency market's complexities often leave investors relying on price charts and technical indicators for clarity. Moving averages are a key example. Recently, Dogecoin (DOGE), a prominent cryptocurrency, displayed a classic bearish pattern.
加密貨幣市場的複雜性通常會使投資者依靠價格圖表和技術指標以確保清晰。 移動平均是一個關鍵示例。 最近,Dogecoin(Doge)是一種突出的加密貨幣,展示了經典的看跌圖案。
A "death cross" formed on DOGE's chart as the 23-day moving average crossed below the 200-day moving average. This often signals a price decline, and indeed, DOGE's price subsequently dropped over 30%, from $0.24 to $0.164. 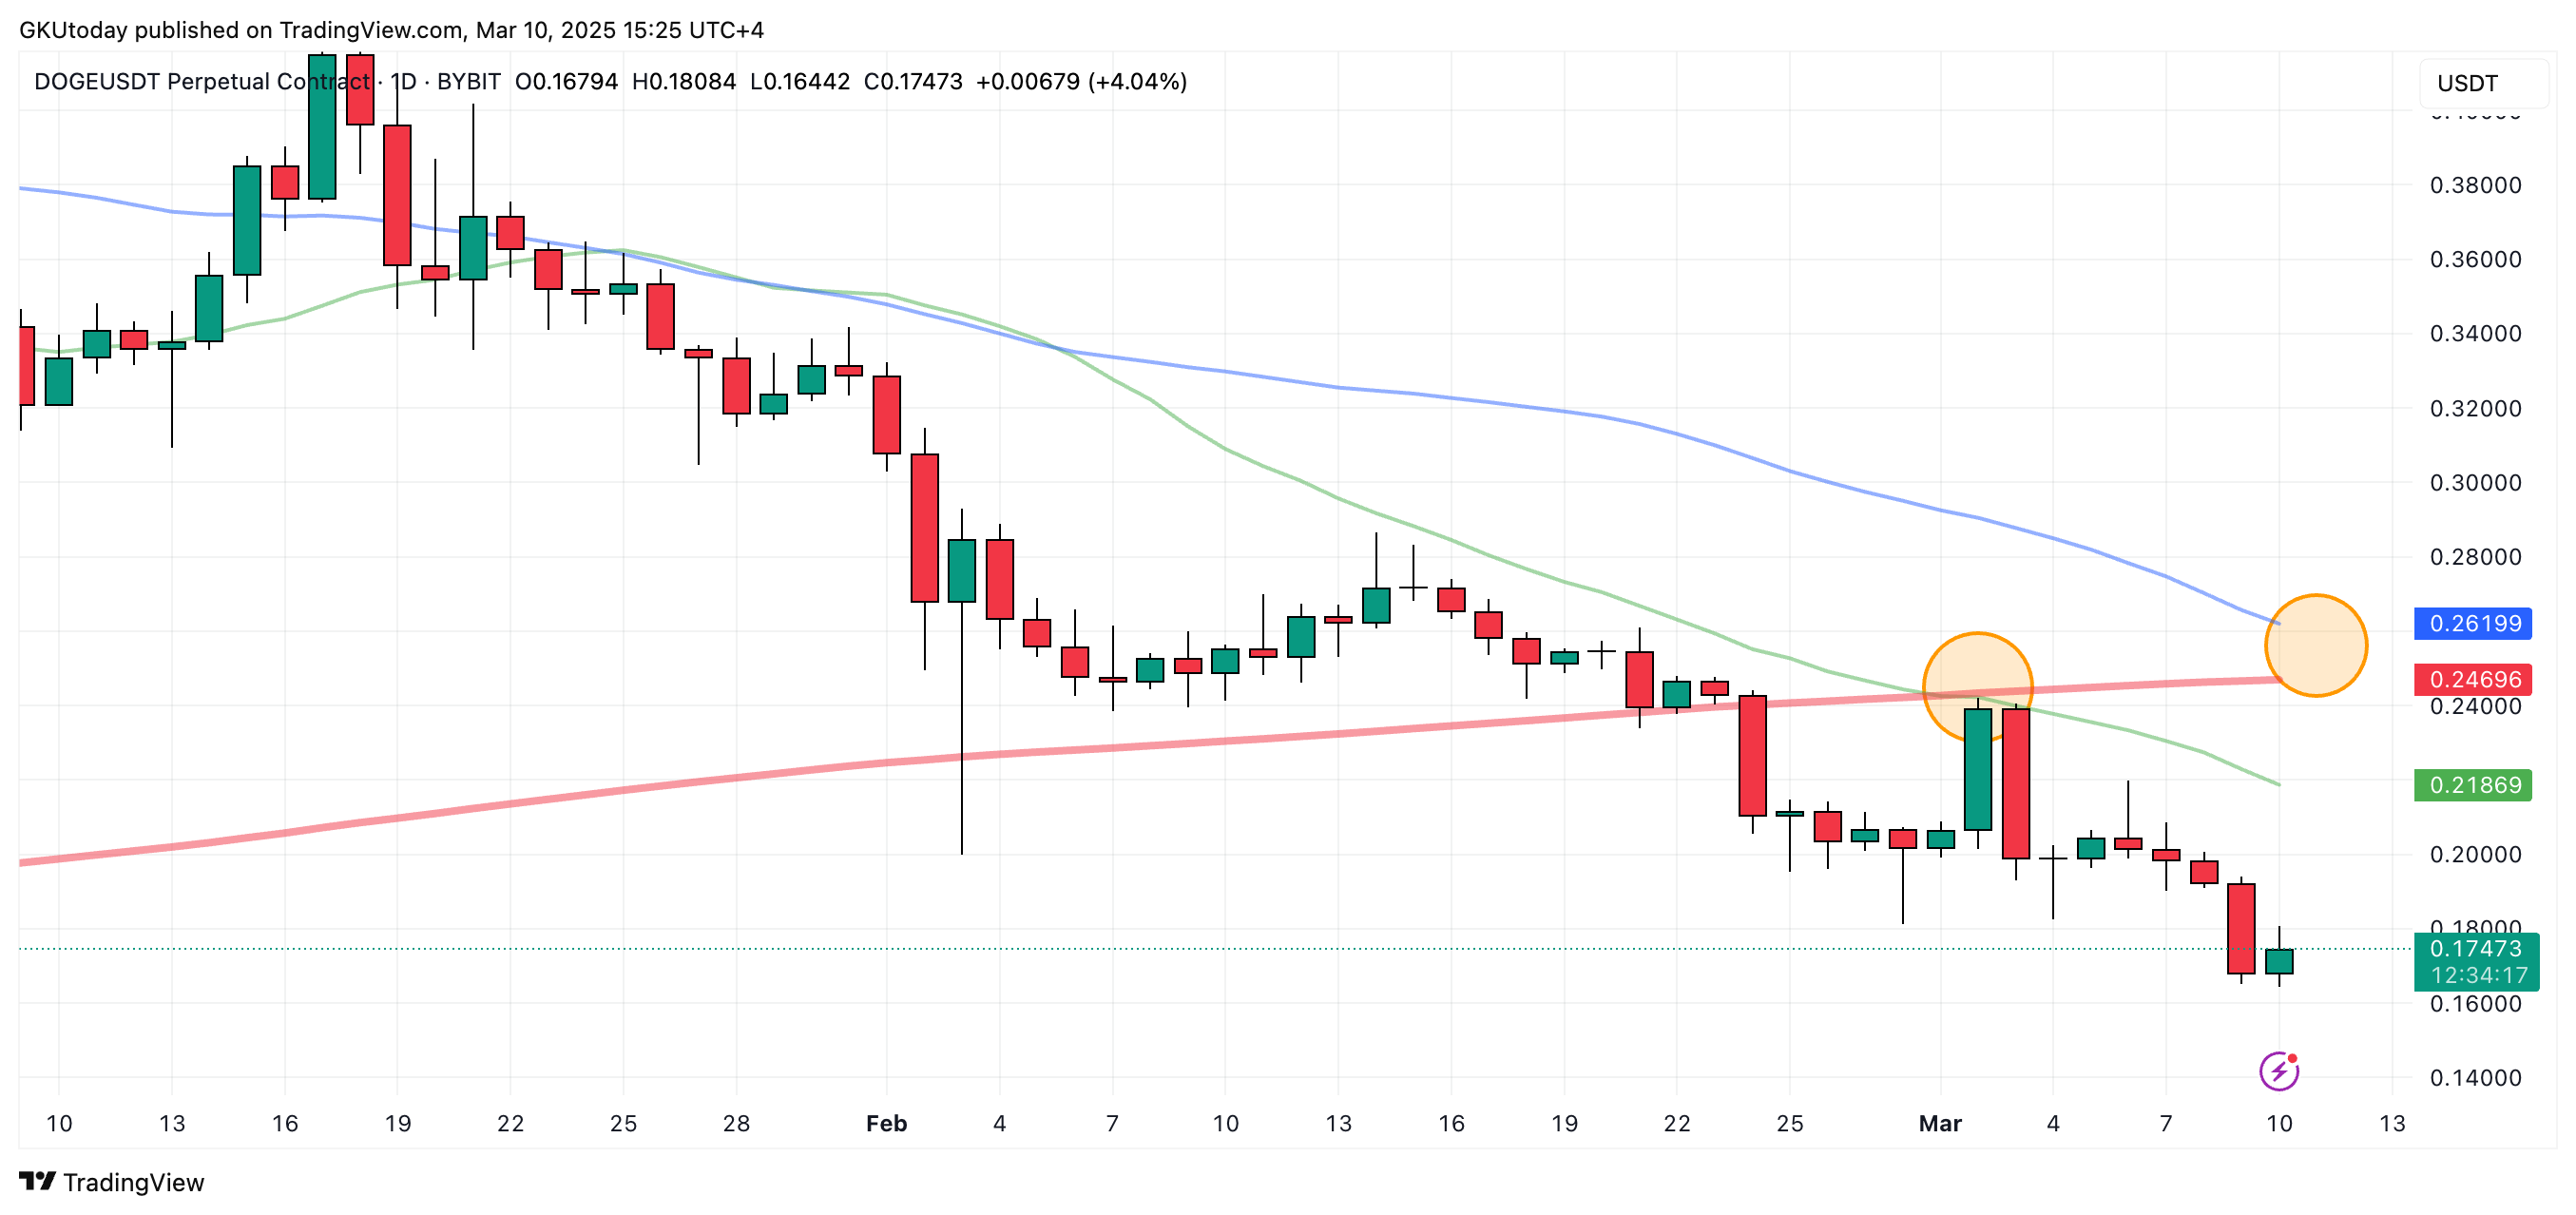 Doge圖表上形成了一個“死亡十字”,因為23天的移動平均線超過200天移動平均線。這通常標誌著價格下跌,實際上,Doge的價格隨後下跌了30%,從0.24美元下降到0.164美元。
Further downward pressure may be imminent. A second death cross is approaching, this time involving the 50-day moving average crossing below the 200-day moving average. While a short-term death cross already caused a 30% drop, this longer-term indicator suggests potential for further declines. While a reversal is possible, given current market trends, it seems less likely.
進一步的向下壓力可能迫在眉睫。 第二個死亡十字架即將接近,這次涉及50天移動平均線以下的5天移動平均線。 雖然短期死亡交叉已經導致30%下降,但該長期指標表明可能進一步下降。 雖然可以進行逆轉,但考慮到當前的市場趨勢,似乎較少的可能性。
The situation highlights the reactive nature of the market. The consequences of another death cross are predictable, but until it occurs, the potential for further Dogecoin price decreases remains. Read original article on U.Today
這種情況突出了市場的反應性。 另一個死亡十字架的後果是可以預測的,但是在發生之前,還存在進一步的狗狗價格下降的可能性。閱讀有關U.Today的原始文章
 DogeHome
 Optimisus
 COINTURK NEWS
 BH NEWS
 BlockchainReporter
 U_Today
 U_Today
 Optimisus


