

Cover image via U.Today
U.Todayを介して画像をカバーします
The cryptocurrency market's complexities often leave investors relying on price charts and technical indicators for clarity. Moving averages are a key example. Recently, Dogecoin (DOGE), a prominent cryptocurrency, displayed a classic bearish pattern.
暗号通貨市場の複雑さは、多くの場合、投資家が価格チャートと明確なために技術的な指標に依存していることがよくあります。 移動平均が重要な例です。 最近、著名な暗号通貨であるDogecoin(Doge)が古典的な弱気パターンを示しました。
A "death cross" formed on DOGE's chart as the 23-day moving average crossed below the 200-day moving average. This often signals a price decline, and indeed, DOGE's price subsequently dropped over 30%, from $0.24 to $0.164. 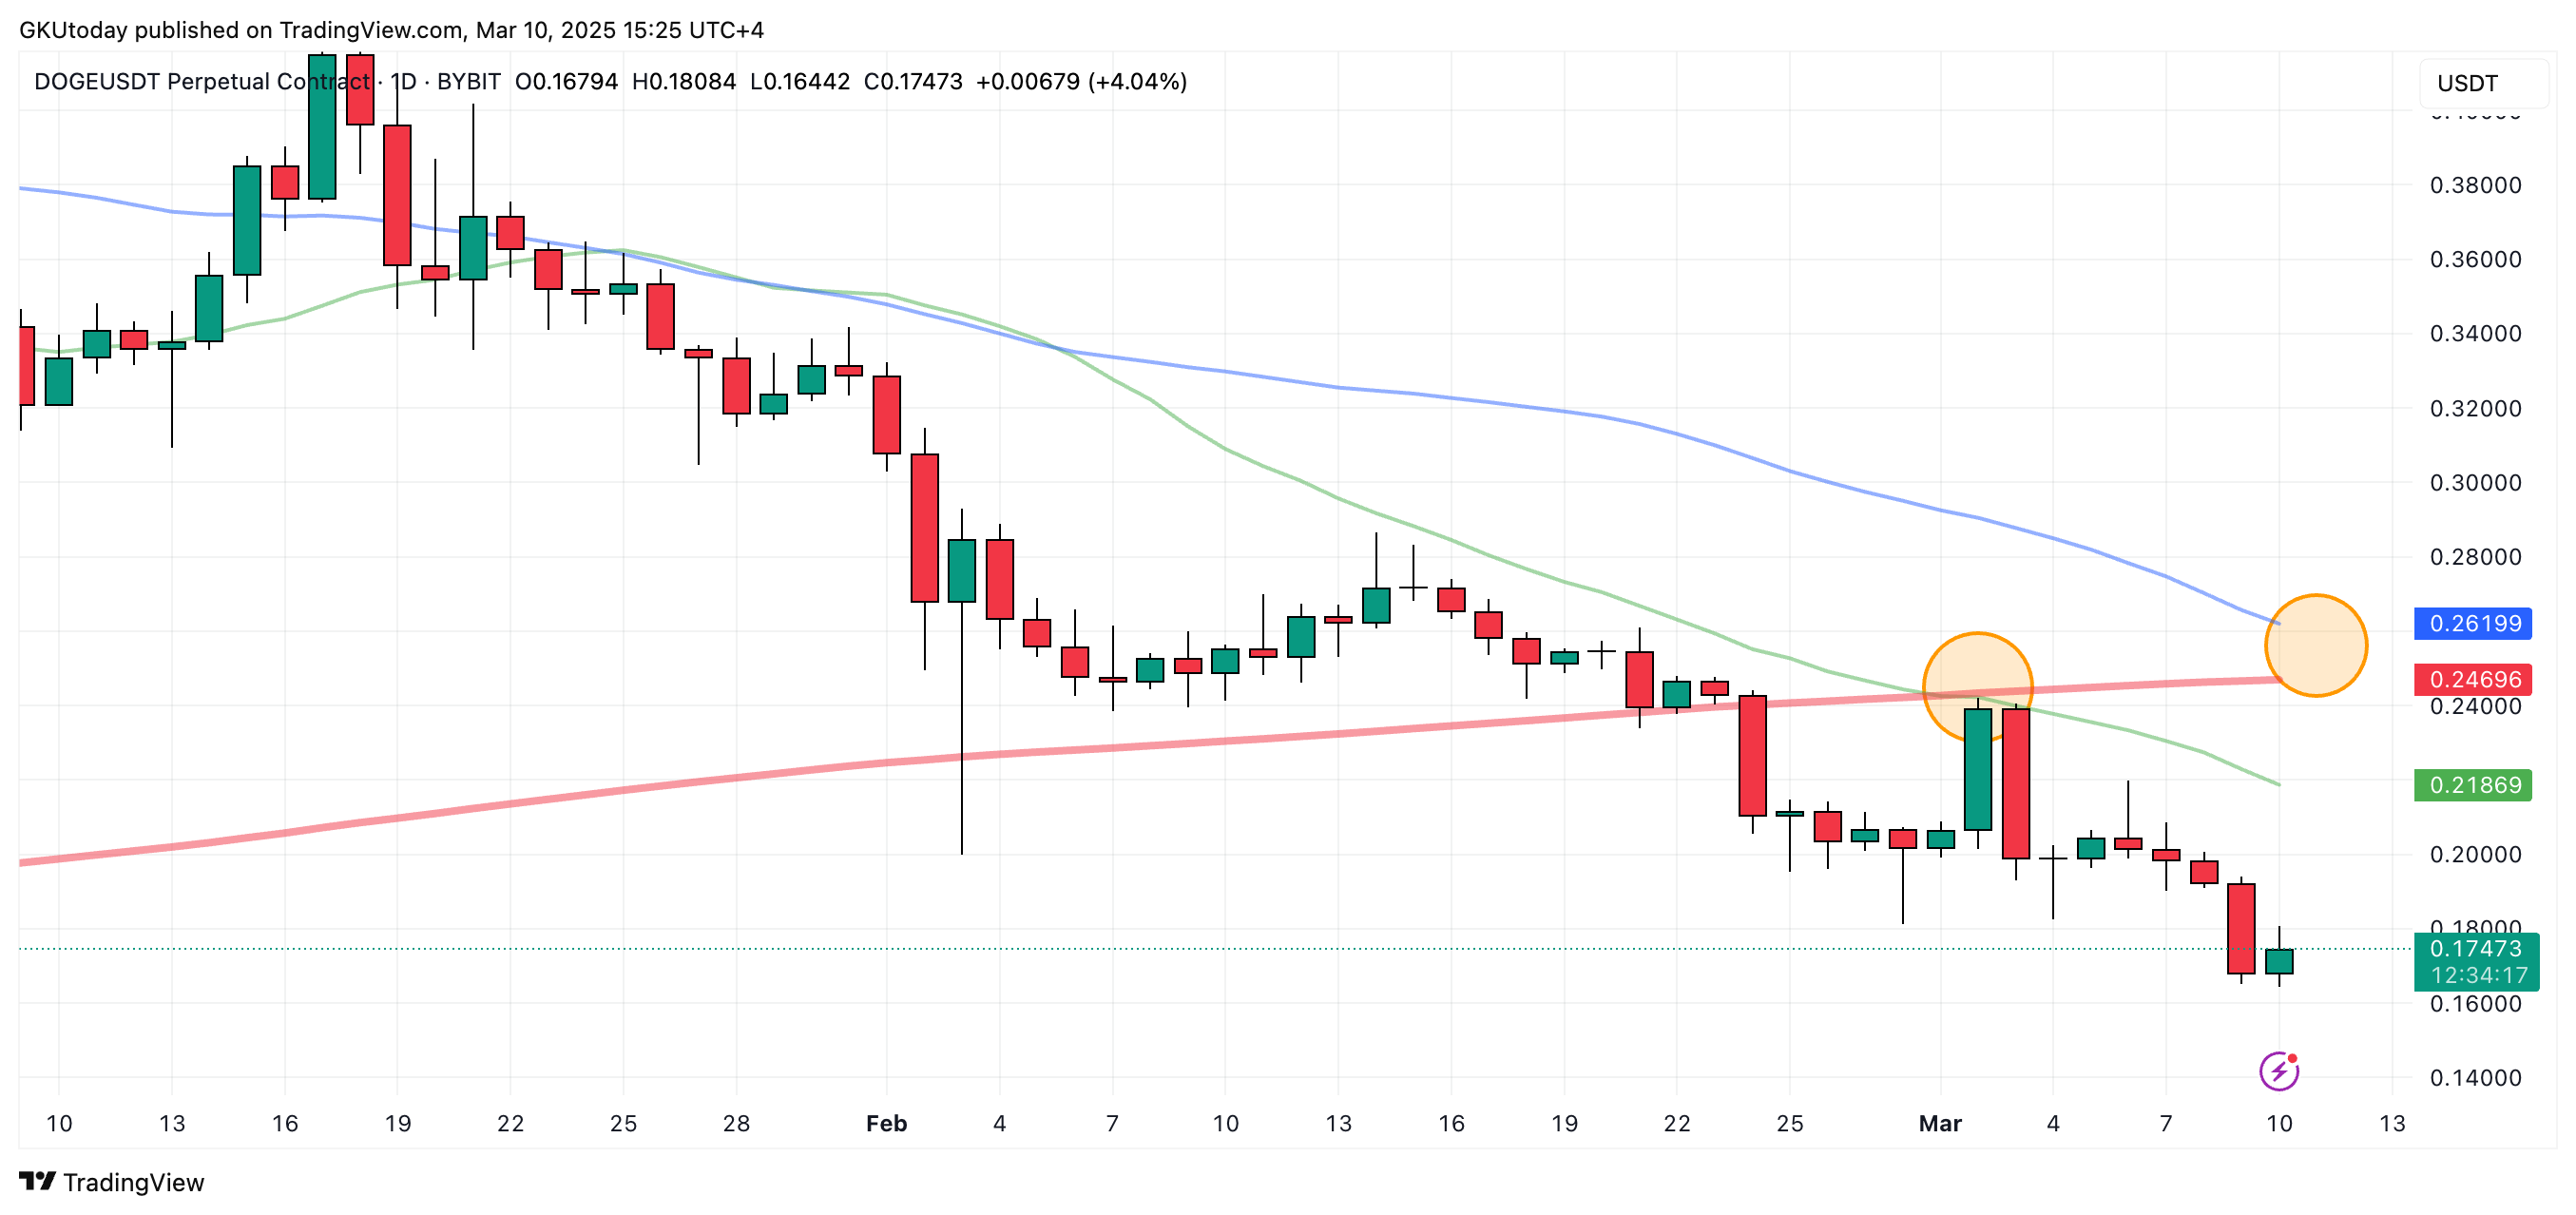 23日間の移動平均が200日間の移動平均を下回ったため、Dogeのチャートに「Death Cross」が形成されました。これは多くの場合、価格の下落を示しており、実際、Dogeの価格はその後0.24ドルから0.164ドルに30%以上下落しました。
Further downward pressure may be imminent. A second death cross is approaching, this time involving the 50-day moving average crossing below the 200-day moving average. While a short-term death cross already caused a 30% drop, this longer-term indicator suggests potential for further declines. While a reversal is possible, given current market trends, it seems less likely.
さらに下向きの圧力が差し迫っている可能性があります。 2回目の死の十字架が近づいています。今回は、200日間の移動平均を下回る50日間の移動平均交差点が含まれます。 短期的な死のクロスはすでに30%の低下を引き起こしましたが、この長期指標はさらなる減少の可能性を示唆しています。 現在の市場動向を考えると、逆転は可能ですが、それは低いと思われます。
The situation highlights the reactive nature of the market. The consequences of another death cross are predictable, but until it occurs, the potential for further Dogecoin price decreases remains. Read original article on U.Today
状況は、市場の反応的な性質を強調しています。 別の死のクロスの結果は予測可能ですが、それが起こるまで、さらなるドッグコインの価格が低下する可能性は残っています。 U.Todayのオリジナル記事を読んでください
 DogeHome
 Optimisus
 COINTURK NEWS
 BH NEWS
 BlockchainReporter
 U_Today
 U_Today
 Optimisus


