Dogecoin (DOGE) faced a strong selling pressure two days ago on October 9. As a result, there were changes in prices and signs reminiscent of June for investors. This situation also reflected the power loss experienced by the bulls and was not considered a positive sign for investors looking to make long-term investments in Dogecoin.
狗狗幣(DOGE)在兩天前的 10 月 9 日面臨強大的拋售壓力。因此,價格和跡象的變化讓投資者想起了 6 月。這種情況也反映了多頭所經歷的權力損失,對於尋求長期投資狗狗幣的投資者來說,這並不是一個正面的訊號。
Due to the volatile market conditions and the war-like atmosphere, a strong bearish sentiment seems to have formed in the market. With this sentiment, a breakthrough can occur in the price support zone. As a result, investors trading on a daily basis may seek opportunities in short positions.
由於市場行情的波動和戰爭氣氛,市場似乎形成了強烈的看跌情緒。有了這種情緒,價格支撐區域可能會出現突破。因此,日常交易的投資者可能會尋求空頭部位機會。
How Much is Dogecoin Worth?
狗狗幣值多少錢?
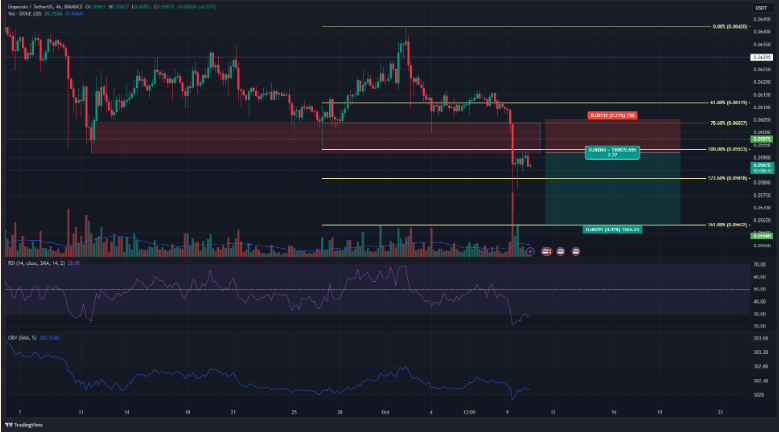
The area indicated by the red box points to an important point. This red box indicates the boundaries of the 4-hour bullish order block located in the $0.06 region. The movement in price on Monday resulted in a breakthrough below this zone. As a result, potential price movements regarding the future of DOGE also emerged.
紅框所指示的區域指向一個重要點。此紅色框表示位於 0.06 美元區域的 4 小時看漲訂單區塊的邊界。週一價格走勢導致突破該區域。因此,有關 DOGE 未來的潛在價格走勢也出現了。
The price rally at the end of September brought a series of Fibonacci retracement levels (pale yellow). This price movement brought along a process in which the price continued from $0.0593 to $0.0642 before the start of the retracement movement.
9月底的價格上漲帶來了一系列斐波那契回檔位(淺黃色)。這次價格走勢帶來了價格從 0.0593 美元持續到回檔運動開始前的 0.0642 美元的過程。
As a result, traders can consider short positions after a possible rejection and retest from the resistance zone ahead of the decline. The Relative Strength Index (RSI), closely monitored by investors, also reflected a clear downward momentum. In addition, On-Balance Volume (OBV) was also in a downward trend in October.
因此,交易者可以在可能的拒絕後考慮空頭頭寸,並在下跌前重新測試阻力區。投資人密切關注的相對強弱指數(RSI)也反映出明顯的下行動能。此外,10月資產負債表量(OBV)也呈現下降趨勢。

The Future of Dogecoin
狗狗幣的未來
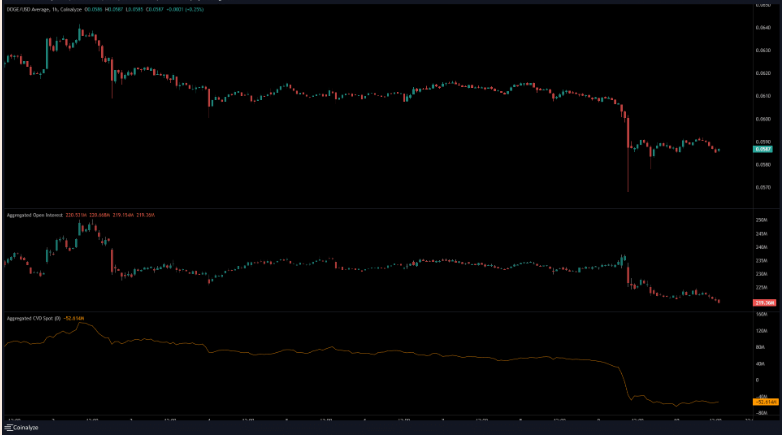
Cumulative Volume Delta (CVD) remained in a sideways trend between October 5 and October 9 when price movements occurred. It started to decline after October 9, Monday. This price decline also showed parallelism with Bitcoin‘s (BTC) movement. During the same period, the price of Bitcoin dropped to $27,400.
10 月 5 日至 9 日價格變動時,累積成交量 Delta (CVD) 仍處於橫盤趨勢。 10月9日星期一之後開始下降。此次價格下跌也與比特幣(BTC)的走勢平行。同一時期,比特幣價格跌至 27,400 美元。
The Open Interest (OI) chart also showed a downward trend. Decreases in open interest generally indicate potential declines in futures. Therefore, larger losses in Dogecoin may be seen in the market in the coming days.
未平倉合約(OI)圖表也呈現下降趨勢。未平倉合約的減少通常表示期貨可能下跌。因此,未來幾天市場上可能會出現狗狗幣更大的損失。

免責聲明:本文提供的資訊不構成投資建議。投資者應意識到,加密貨幣由於其高波動性而具有風險,因此在進行任何交易之前應進行自己的研究。
繼續閱讀:https://en.coin-turk.com/will-the-fear-in-dogecoin-come-true-how-did-bitcoins-price-movement-affect-dogecoin-are-investors-running-away /


 DogeHome
 Optimisus
 CFN
CFN Optimisus
 BlockchainReporter
 CFN
CFN CFN
CFN


