Dogecoin (DOGE) faced a strong selling pressure two days ago on October 9. As a result, there were changes in prices and signs reminiscent of June for investors. This situation also reflected the power loss experienced by the bulls and was not considered a positive sign for investors looking to make long-term investments in Dogecoin.
ドージコイン(DOGE)は2日前の10月9日に強い売り圧力に直面しました。その結果、価格の変化や投資家にとって6月を彷彿とさせる兆候が見られました。この状況は強気派が経験した電力損失も反映しており、ドージコインへの長期投資を検討している投資家にとっては前向きな兆候とは考えられなかった。
Due to the volatile market conditions and the war-like atmosphere, a strong bearish sentiment seems to have formed in the market. With this sentiment, a breakthrough can occur in the price support zone. As a result, investors trading on a daily basis may seek opportunities in short positions.
不安定な市況と戦争のような雰囲気により、市場には強い弱気ムードが形成されているようだ。このセンチメントにより、価格サポートゾーンでブレイクスルーが発生する可能性があります。その結果、毎日取引を行う投資家はショートポジションで機会を求める可能性があります。
How Much is Dogecoin Worth?
ドージコインの価値はいくらですか?
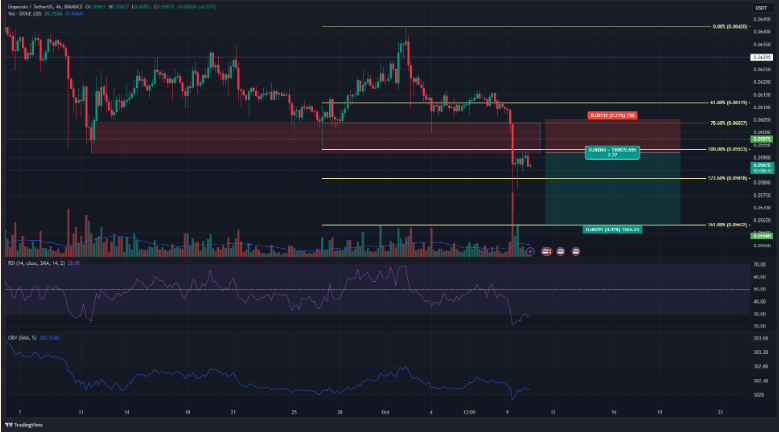
The area indicated by the red box points to an important point. This red box indicates the boundaries of the 4-hour bullish order block located in the $0.06 region. The movement in price on Monday resulted in a breakthrough below this zone. As a result, potential price movements regarding the future of DOGE also emerged.
赤枠で示した部分が重要なポイントを示しています。この赤いボックスは、0.06 ドルの領域にある 4 時間の強気注文ブロックの境界を示しています。月曜日の価格の動きにより、このゾーンを下抜けました。その結果、DOGEの将来に関する潜在的な値動きも浮上しました。
The price rally at the end of September brought a series of Fibonacci retracement levels (pale yellow). This price movement brought along a process in which the price continued from $0.0593 to $0.0642 before the start of the retracement movement.
9月末の価格上昇により、一連のフィボナッチ・リトレースメント・レベル(薄黄色)が発生しました。この価格変動は、リトレースメントの動きが始まる前に、価格が 0.0593 ドルから 0.0642 ドルまで継続するプロセスをもたらしました。
As a result, traders can consider short positions after a possible rejection and retest from the resistance zone ahead of the decline. The Relative Strength Index (RSI), closely monitored by investors, also reflected a clear downward momentum. In addition, On-Balance Volume (OBV) was also in a downward trend in October.
その結果、トレーダーは拒否の可能性の後にショートポジションを検討し、下落に先立ってレジスタンスゾーンから再テストすることができます。投資家が注意深く監視している相対力指数(RSI)も、明らかな下降傾向を反映しています。また、10月にはオンバランスボリューム(OBV)も減少傾向にありました。

The Future of Dogecoin
ドージコインの未来
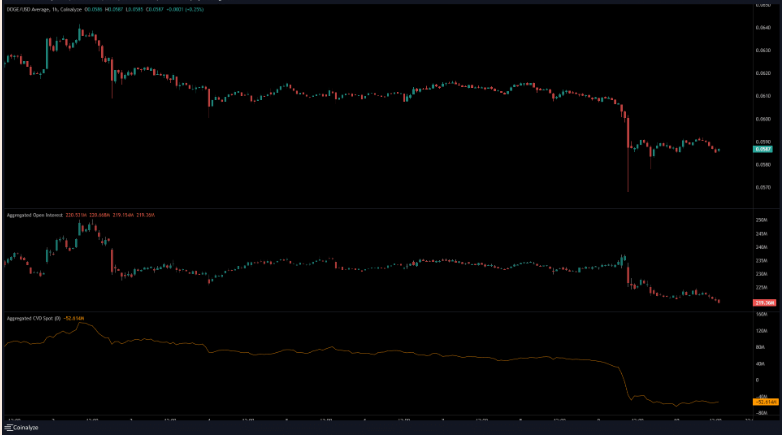
Cumulative Volume Delta (CVD) remained in a sideways trend between October 5 and October 9 when price movements occurred. It started to decline after October 9, Monday. This price decline also showed parallelism with Bitcoin‘s (BTC) movement. During the same period, the price of Bitcoin dropped to $27,400.
累積出来高デルタ(CVD)は、価格変動が発生した10月5日から10月9日まで横ばい傾向が続きました。 10月9日月曜日以降、減少し始めました。この価格下落は、ビットコイン (BTC) の動きと並行していることも示しました。同じ期間に、ビットコインの価格は27,400ドルまで下落しました。
The Open Interest (OI) chart also showed a downward trend. Decreases in open interest generally indicate potential declines in futures. Therefore, larger losses in Dogecoin may be seen in the market in the coming days.
建玉(OI)チャートも下降傾向を示しました。建玉の減少は一般に、先物価格の下落の可能性を示しています。したがって、ドージコインの今後数日間の市場では、より大きな損失が見られる可能性があります。

免責事項: この記事で提供される情報は投資アドバイスを構成するものではありません。投資家は、暗号通貨にはボラティリティが高いためリスクがあることを認識し、取引を行う前に独自の調査を行う必要があります。
続きを読む: https://en.coin-turk.com/will-the-fear-in-dogecoin-come-true-how-did-bitcoins-price-movement-affect-dogecoin-are-investors-running-away /


 Coin Edition
 Cryptopolitan_News
 BlockchainReporter
 crypto.news
 Crypto Daily™
 BlockchainReporter
 Optimisus
 DogeHome
 Crypto News Land


