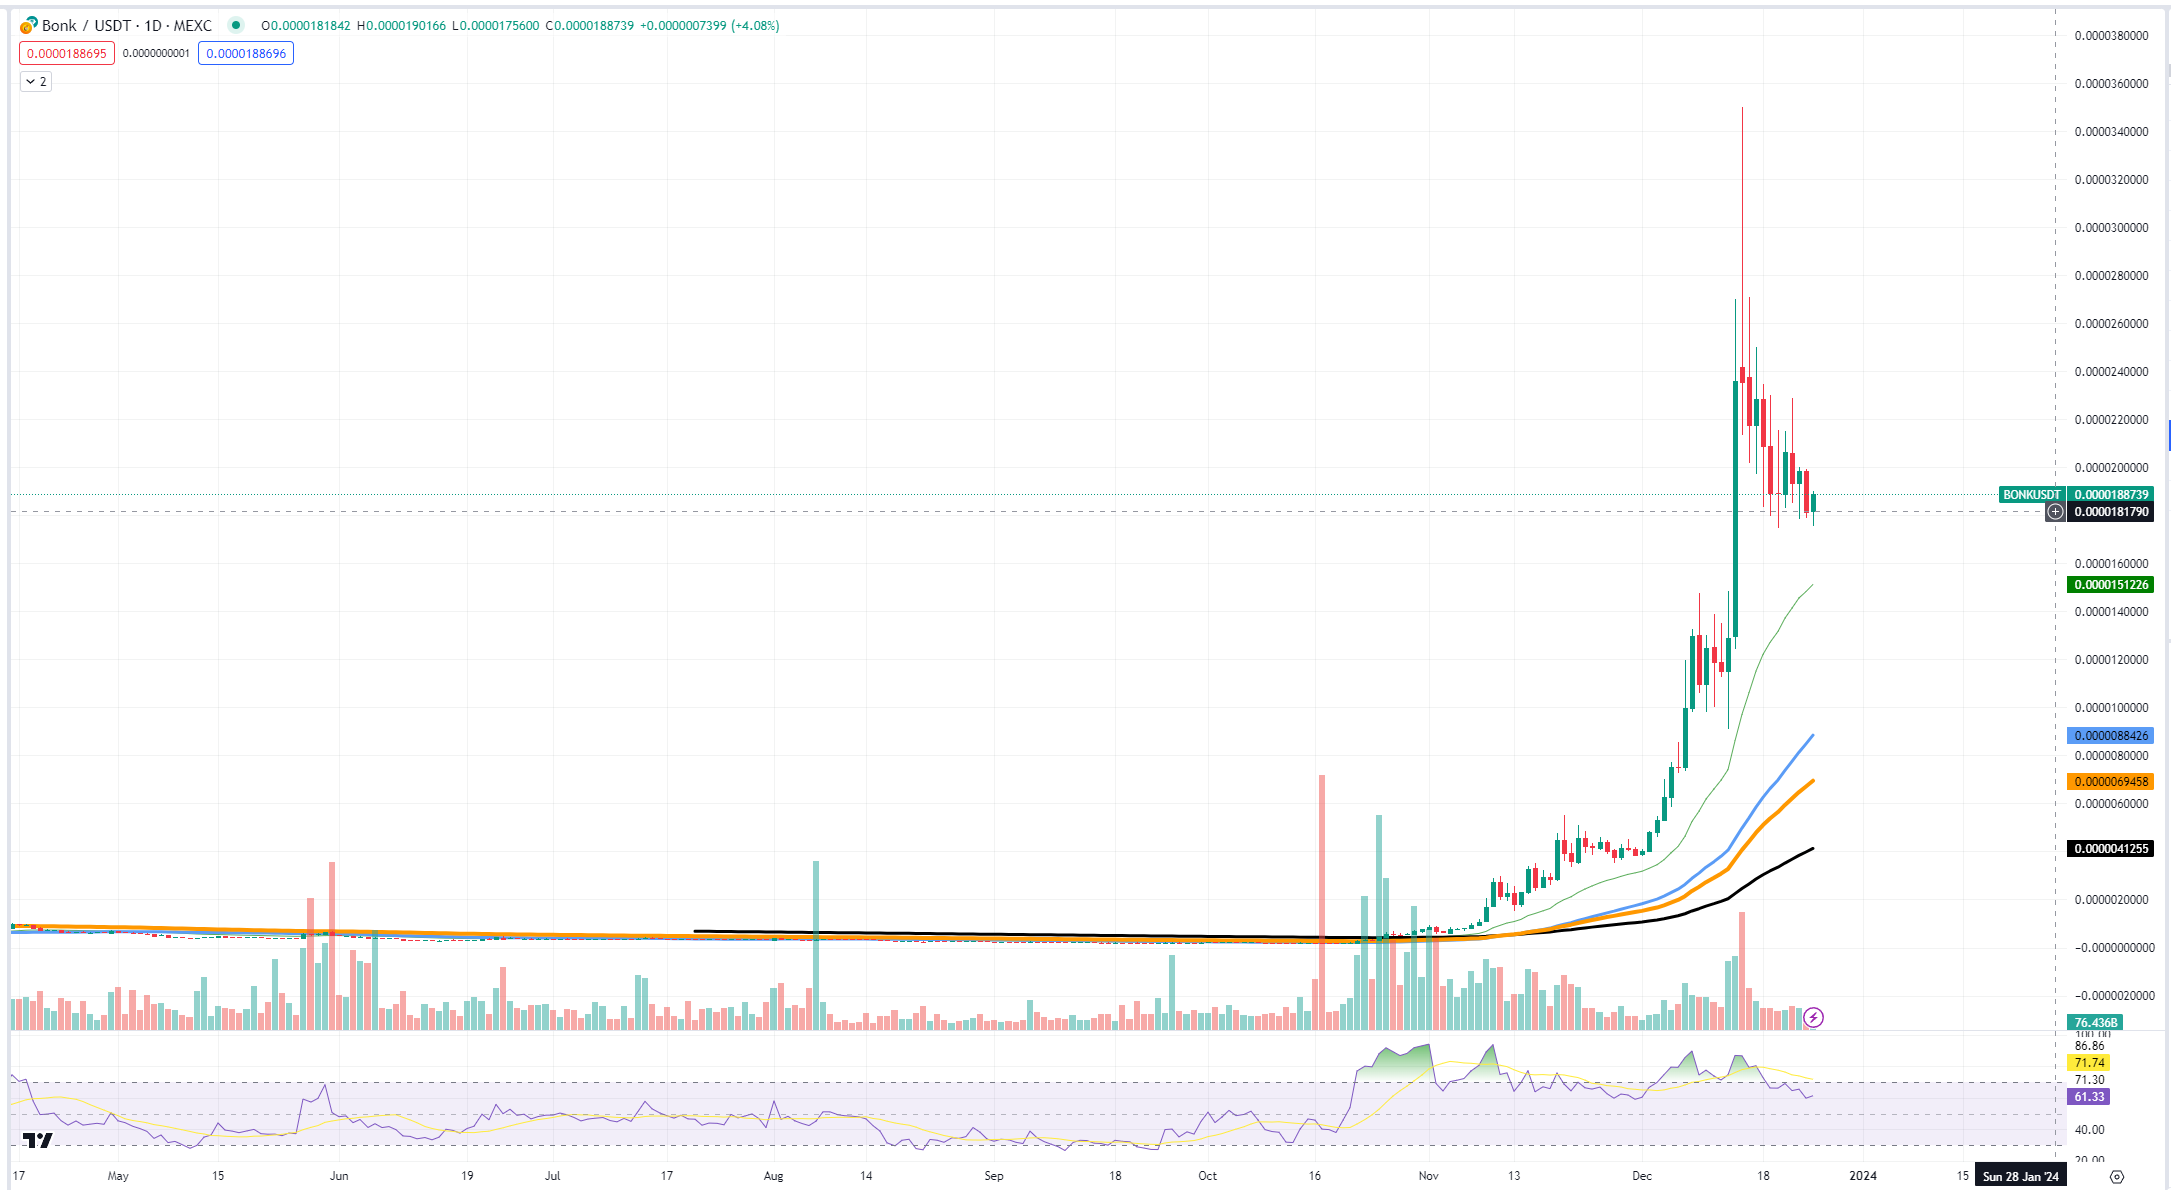
Bonk has seen a precipitous decline in its market value, evidenced by the recent price chart that indicates a loss of nearly 50% from its peak. This dramatic downturn highlights the risks inherent in investing in highly volatile digital assets, particularly those like BONK, which may be influenced by their novelty or "meme" status rather than underlying fundamentals.
Bonk 的市值急劇下跌,最近的價格圖表顯示其市值較高峰下跌了近 50%。這種急劇的下滑凸顯了投資高度波動的數位資產所固有的風險,尤其是像BONK 這樣的資產,這些資產可能受到其新穎性或「迷因」狀態的影響,而不是受到潛在基本面的影響。
The chart analysis of BONK's price action reveals a steep ascent followed by a sharp decline, a pattern reminiscent of other meme coins, such as Shiba Inu. These types of cryptocurrencies often attract attention and investment due to social media hype and speculative trading, resulting in rapid price increases.
BONK 價格走勢的圖表分析顯示,先急劇上升,然後急劇下降,這種模式讓人想起柴犬等其他模因幣。這類加密貨幣往往因社群媒體炒作和投機交易而吸引關注和投資,導致價格快速上漲。
 BONK/USDT Chart by TradingView
BONK/USDT 圖表(TradingView)
However, without substantial technological or economic underpinnings, they tend to suffer equally rapid declines, leaving investors facing significant losses.
然而,如果沒有實質的技術或經濟基礎,它們往往會遭受同樣快速的下跌,使投資者面臨重大損失。
For those who have engaged in leveraged investments, the drop in BONK's value is especially troubling. Leverage can amplify gains during market upswings but can result in magnified losses when the price falls. The halving of BONK's value is a stark reminder of the perils of leveraging on the volatile cryptocurrency market, where the line between profit and loss can be alarmingly thin.
對於從事槓桿投資的人來說,BONK價值的下跌尤其令人不安。槓桿可以在市場上漲時放大收益,但在價格下跌時可能導致損失放大。 BONK 價值減半清楚地提醒人們,利用波動較大的加密貨幣市場存在槓桿風險,利潤和虧損之間的界線可能非常薄弱。
BONK's trajectory parallels that of Shiba Inu, which experienced an explosive entry onto the cryptocurrency scene, capturing the imagination and wallets of investors looking for the next big win. Yet, as the initial excitement waned, the price struggled to maintain its meteoric heights, leading to substantial pullbacks.
BONK 的發展軌跡與 Shiba Inu 的發展軌跡相似,後者經歷了爆炸式的進入加密貨幣領域,吸引了尋求下一次大勝利的投資者的想像和錢包。然而,隨著最初的興奮消退,價格難以維持其飛速高位,導致大幅回檔。
Pivotal moment for Doge
總督的關鍵時刻
As Dogecoin encounters a pivotal support level, a trend reversal looms on the horizon and creates a possibility for investors. Notably, legacy meme coins like DOGE often exhibit reversals at the final stages of extremely volatile markets, signaling an inflection point. The current chart demonstrates DOGE approaching the 26-day exponential moving average.
當狗狗幣遇到關鍵支撐位時,趨勢逆轉即將出現,並為投資者創造了可能性。值得注意的是,像 DOGE 這樣的傳統迷因幣經常在極度波動的市場的最後階段出現逆轉,標誌著拐點。目前圖表顯示 DOGE 接近 26 天指數移動平均線。
The 26-day EMA is predominantly utilized in stock market analysis, providing a dynamic level of support or resistance based on the average closing prices of the past 26 days, weighted to favor more recent price action. Despite its roots in equities, its application to the Dogecoin chart appears valid.
26 天均線主要用於股市分析,根據過去 26 天的平均收盤價提供動態的支撐或阻力水平,並加權以支持最近的價格走勢。儘管它植根於股票,但它在狗狗幣圖表中的應用似乎是有效的。
The reasoning behind this is that while cryptocurrencies are known for their volatility, they still adhere to some of the fundamental principles of technical analysis. The EMA serves as a smoother and more responsive version of the simple moving average, making it particularly suitable for the fast-moving crypto market.
背後的原因是,雖然加密貨幣以其波動性而聞名,但它們仍然遵循技術分析的一些基本原則。 EMA 作為簡單移動平均線的更平滑、響應更靈敏的版本,使其特別適合快速變化的加密貨幣市場。
In the current scenario, Dogecoin's approach to the 26-day EMA coincides with a reduction in trading volume, as indicated by the volume bars beneath the price chart. This convergence could be indicative of a consolidation phase, often a precursor to a significant price movement. A declining volume suggests reduced selling pressure, which, when coupled with the support level provided by the EMA, raises the potential for a bullish reversal.
在當前情況下,狗狗幣接近 26 天均線時,交易量減少,如價格圖表下方的交易量條所示。這種趨同可能預示著盤整階段,通常是價格大幅波動的前兆。成交量下降表明拋售壓力減少,再加上 EMA 提供的支撐位,增加了看漲逆轉的可能性。
End for Solana?
索拉納結束了嗎?
The Solana (SOL) price chart is exhibiting potential early signs of a reversal, which may suggest an impending correction phase. A recent candlestick formation on the chart displays characteristics commonly associated with trend exhaustion, which can often precede a shift in market sentiment.
Solana (SOL) 價格圖表顯示出潛在反轉的早期跡象,這可能表明即將進入修正階段。圖表上最近的燭台形態顯示了通常與趨勢耗盡相關的特徵,這通常可以先於市場情緒的轉變。
Upon closer examination of the chart, a distinct candle with a long upper shadow can be identified, indicating that while buyers pushed the price higher within the period, there was a significant sell-off that brought the price down from its highs. Such price action typically reflects uncertainty on the market and can be an early warning sign of a changing tide, especially after a strong uptrend.
仔細檢查圖表後,可以發現一根帶有長上影線的明顯蠟燭,表明雖然買家在此期間推高價格,但出現了大幅拋售,導致價格從高點回落。這種價格走勢通常反映了市場的不確定性,並且可能是潮流變化的早期預警訊號,尤其是在強勁的上漲趨勢之後。
The technical indicators further buttress the notion of an overextension in Solana's recent price surge. The Relative Strength Index has ventured into overbought territory, a level above 70, for an extended period. Historically, such elevated RSI readings suggest the asset may be due for a retracement.
技術指標進一步支持了 Solana 近期價格飆升過度擴張的觀點。相對強弱指數已在較長一段時間內進入超買區域,即 70 以上的水平。從歷史上看,這種較高的 RSI 讀數表明該資產可能會出現回調。
From a market capitalization perspective, Solana's rapid appreciation to a valuation of 48 billion USD positions it as the third-largest cryptocurrency by market cap. This substantial growth brings into question the sustainability of its rally from both the technical and financial viewpoints.
從市值角度來看,Solana 估值迅速升值至 480 億美元,使其成為市值第三大加密貨幣。從技術和財務角度來看,這種大幅成長讓人質疑其反彈的可持續性。
Investors and traders should be aware that the first signs of a potential reversal, coupled with extremely overbought status, may indicate that a period of price consolidation or correction could be on the horizon for Solana.
投資者和交易者應該意識到,潛在逆轉的最初跡象,加上極度超買狀態,可能表明 Solana 可能即將迎來一段價格盤整或調整期。


 TheNewsCrypto
 CFN
CFN DogeHome
 Optimisus
 Crypto News Land
 Optimisus
 Cryptopolitan_News


