

Bonk has seen a precipitous decline in its market value, evidenced by the recent price chart that indicates a loss of nearly 50% from its peak. This dramatic downturn highlights the risks inherent in investing in highly volatile digital assets, particularly those like BONK, which may be influenced by their novelty or "meme" status rather than underlying fundamentals.
ボンクの市場価値は急激に下落しており、最近の価格チャートがピーク時から50%近く下落していることが証明されている。この劇的な景気後退は、特にBONKのような非常に不安定なデジタル資産への投資に内在するリスクを浮き彫りにしており、基礎となるファンダメンタルズではなく、その新規性や「ミーム」ステータスによって影響を受ける可能性がある。
The chart analysis of BONK's price action reveals a steep ascent followed by a sharp decline, a pattern reminiscent of other meme coins, such as Shiba Inu. These types of cryptocurrencies often attract attention and investment due to social media hype and speculative trading, resulting in rapid price increases.
BONKの価格変動のチャート分析では、急激な上昇とそれに続く急激な下落が明らかになり、このパターンは柴犬などの他のミームコインを彷彿とさせます。これらのタイプの暗号通貨は、ソーシャルメディアでの誇大宣伝や投機的取引により注目と投資を集めることが多く、その結果、価格が急速に上昇します。
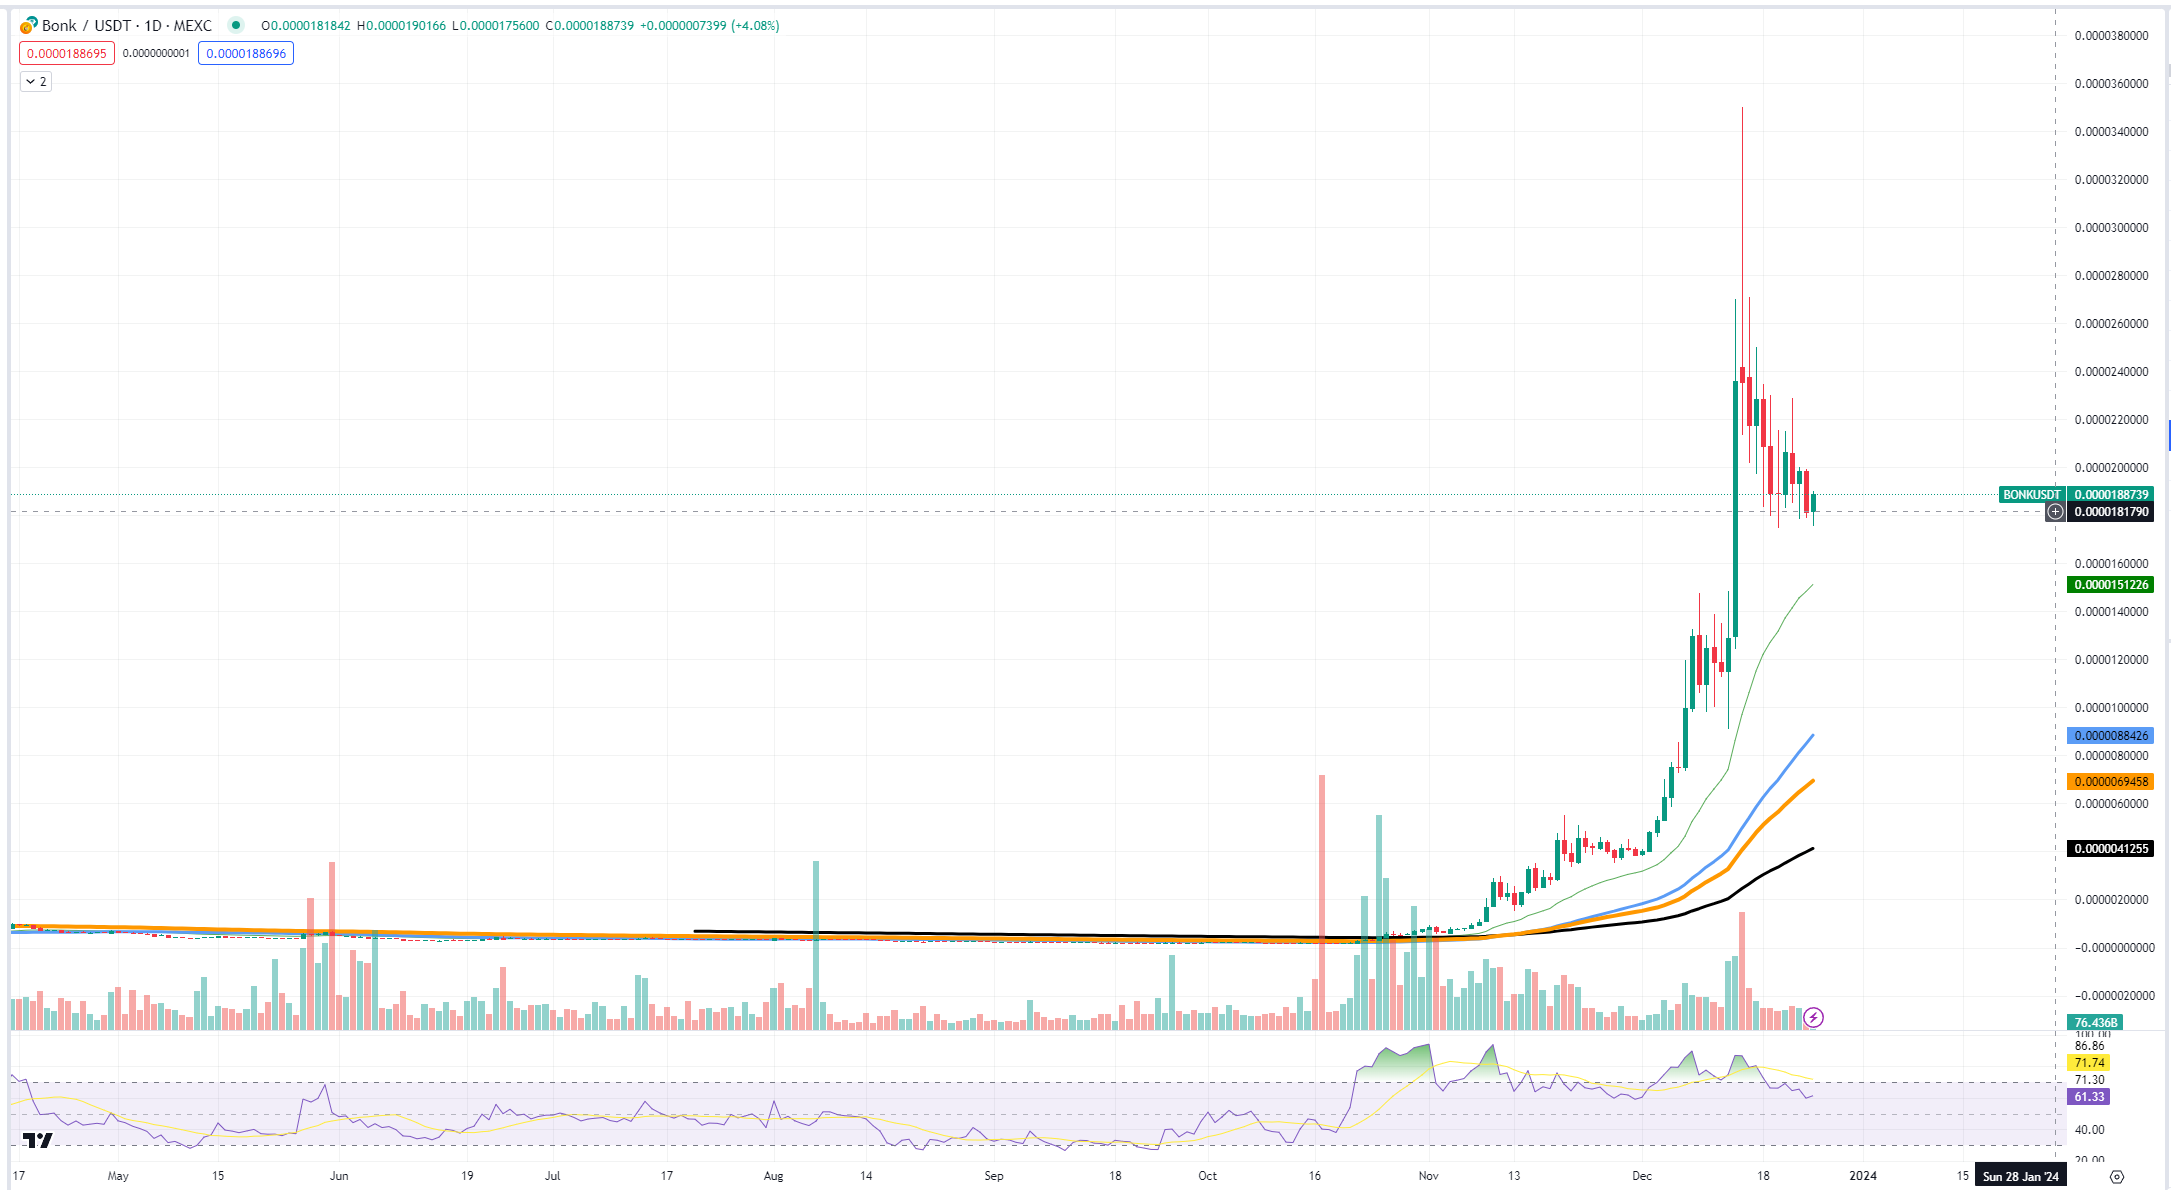 BONK/USDT Chart by TradingView
TradingViewによるBONK/USDTチャート
However, without substantial technological or economic underpinnings, they tend to suffer equally rapid declines, leaving investors facing significant losses.
しかし、実質的な技術的または経済的基盤がなければ、同様に急速な下落に見舞われる傾向があり、投資家は重大な損失に直面することになります。
For those who have engaged in leveraged investments, the drop in BONK's value is especially troubling. Leverage can amplify gains during market upswings but can result in magnified losses when the price falls. The halving of BONK's value is a stark reminder of the perils of leveraging on the volatile cryptocurrency market, where the line between profit and loss can be alarmingly thin.
レバレッジ投資を行ってきた人にとって、BONKの価値の下落は特に憂慮すべきことだ。レバレッジは市場の上昇局面では利益を増幅させる可能性がありますが、価格下落時には損失が拡大する可能性があります。 BONKの価値の半減は、利益と損失の境界線が驚くほど薄い可能性がある不安定な仮想通貨市場でレバレッジを利かせることの危険性をはっきりと思い起こさせるものである。
BONK's trajectory parallels that of Shiba Inu, which experienced an explosive entry onto the cryptocurrency scene, capturing the imagination and wallets of investors looking for the next big win. Yet, as the initial excitement waned, the price struggled to maintain its meteoric heights, leading to substantial pullbacks.
BONK の軌跡は、仮想通貨シーンへの爆発的な参入を経験し、次の大きな勝利を求める投資家の想像力と財布を魅了した柴犬の軌跡と似ています。しかし、当初の興奮が薄れるにつれ、価格は流星のような高さを維持するのに苦労し、大幅な下落につながった。
Pivotal moment for Doge
ドージェにとって重要な瞬間
As Dogecoin encounters a pivotal support level, a trend reversal looms on the horizon and creates a possibility for investors. Notably, legacy meme coins like DOGE often exhibit reversals at the final stages of extremely volatile markets, signaling an inflection point. The current chart demonstrates DOGE approaching the 26-day exponential moving average.
ドージコインが極めて重要なサポートレベルに遭遇すると、トレンド反転が目前に迫り、投資家に可能性が生まれます。特に、DOGEのようなレガシーミームコインは、非常に不安定な市場の最終段階で反転を示し、変曲点を示唆することがよくあります。現在のチャートは、DOGE が 26 日指数移動平均に近づいていることを示しています。
The 26-day EMA is predominantly utilized in stock market analysis, providing a dynamic level of support or resistance based on the average closing prices of the past 26 days, weighted to favor more recent price action. Despite its roots in equities, its application to the Dogecoin chart appears valid.
26 日間 EMA は主に株式市場の分析に利用され、過去 26 日間の平均終値に基づいて、より最近の値動きを有利にするように重み付けされた動的なレベルのサポートまたはレジスタンスを提供します。そのルーツは株式にあるにもかかわらず、ドージコインのチャートへの適用は有効であるように見えます。
The reasoning behind this is that while cryptocurrencies are known for their volatility, they still adhere to some of the fundamental principles of technical analysis. The EMA serves as a smoother and more responsive version of the simple moving average, making it particularly suitable for the fast-moving crypto market.
この背後にある理由は、暗号通貨はボラティリティが高いことで知られていますが、依然としてテクニカル分析の基本原則の一部を遵守しているためです。 EMA は、単純移動平均のよりスムーズで応答性の高いバージョンとして機能するため、動きの速い暗号通貨市場に特に適しています。
In the current scenario, Dogecoin's approach to the 26-day EMA coincides with a reduction in trading volume, as indicated by the volume bars beneath the price chart. This convergence could be indicative of a consolidation phase, often a precursor to a significant price movement. A declining volume suggests reduced selling pressure, which, when coupled with the support level provided by the EMA, raises the potential for a bullish reversal.
現在のシナリオでは、価格チャートの下の出来高バーで示されているように、ドージコインの 26 日間 EMA へのアプローチは取引量の減少と一致しています。この収束は統合段階を示している可能性があり、多くの場合、大きな価格変動の前兆となります。出来高の減少は売り圧力の低下を示唆しており、EMAが提供するサポートレベルと組み合わせると、強気反転の可能性が高まります。
End for Solana?
ソラナで終わり?
The Solana (SOL) price chart is exhibiting potential early signs of a reversal, which may suggest an impending correction phase. A recent candlestick formation on the chart displays characteristics commonly associated with trend exhaustion, which can often precede a shift in market sentiment.
ソラナ (SOL) 価格チャートは反転の潜在的な初期の兆候を示しており、差し迫った調整段階を示唆している可能性があります。チャート上の最近のローソク足の形成は、一般にトレンドの枯渇に関連する特徴を示しており、多くの場合、市場センチメントの変化に先行する可能性があります。
Upon closer examination of the chart, a distinct candle with a long upper shadow can be identified, indicating that while buyers pushed the price higher within the period, there was a significant sell-off that brought the price down from its highs. Such price action typically reflects uncertainty on the market and can be an early warning sign of a changing tide, especially after a strong uptrend.
チャートを詳しく調べると、長い上影を伴う明確なローソク足が確認できます。これは、買い手が期間内に価格を押し上げた一方で、価格を高値から引き下げる大幅な売りがあったことを示しています。このような価格動向は通常、市場の不確実性を反映しており、特に強い上昇トレンドの後では、潮流の変化を示す早期の警告サインである可能性があります。
The technical indicators further buttress the notion of an overextension in Solana's recent price surge. The Relative Strength Index has ventured into overbought territory, a level above 70, for an extended period. Historically, such elevated RSI readings suggest the asset may be due for a retracement.
テクニカル指標は、ソラナの最近の価格急騰の行き過ぎの概念をさらに裏付けるものとなっている。相対力指数は長期にわたり、70を超える買われ過ぎの領域に突入した。歴史的に、このような RSI 測定値の上昇は、その資産がリトレースメントの時期を迎えている可能性があることを示唆しています。
From a market capitalization perspective, Solana's rapid appreciation to a valuation of 48 billion USD positions it as the third-largest cryptocurrency by market cap. This substantial growth brings into question the sustainability of its rally from both the technical and financial viewpoints.
時価総額の観点から見ると、ソラナの評価額は 480 億米ドルにまで急速に上昇しており、時価総額で 3 番目に大きな仮想通貨としての地位を確立しています。この大幅な成長は、技術的および財務的な観点の両方から、その上昇の持続可能性に疑問を投げかけています。
Investors and traders should be aware that the first signs of a potential reversal, coupled with extremely overbought status, may indicate that a period of price consolidation or correction could be on the horizon for Solana.
投資家やトレーダーは、極度に買われすぎている状況と相まって、潜在的な反転の最初の兆候は、ソラナの価格安定または調整の時期が近づいている可能性があることを示している可能性があることに注意する必要があります。
 DogeHome
 Optimisus
 Crypto News Land
 Optimisus
 Cryptopolitan_News
 Cryptopolitan
 crypto.ro English


