The resurgence of Bitcoin and alternative cryptocurrencies is encountering higher-level resistance, suggesting a prevailing negative sentiment.
比特幣和其他加密貨幣的復甦遇到了更高程度的阻力,顯示普遍存在負面情緒。
Since April, Bitcoin has remained within a substantial trading range, reflecting uncertainty regarding its next directional shift. The attempts by bearish traders to push the price below the range’s support were successfully countered by bullish traders on September 11. Nevertheless, Bitcoin’s outlook remains uncertain.
自四月以來,比特幣一直保持在大幅交易區間內,反映出其下一步方向轉變的不確定性。 9 月 11 日,看跌交易者試圖將價格推低至區間支撐位以下,但被看漲交易者成功反擊。儘管如此,比特幣的前景仍然不確定。
According to Jamie Coutts, a certified market technician and crypto market analyst at Bloomberg Intelligence, if the tightening economic conditions persist, increased unemployment and mounting pressures in the banking sector could lead to further challenges for assets like Bitcoin.
彭博資訊(Bloomberg Intelligence) 認證市場技術員兼加密貨幣市場分析師 Jamie Coutts 表示,如果經濟情勢持續緊縮,失業率上升和銀行業壓力加大可能會給比特幣等資產帶來進一步挑戰。
Cryptocurrency traders have also remained cautious. A Bitfinex report shows the cryptocurrency industry witnessed capital outflows of $55 billion in August. The drop in liquidity has caused isolated events to “have a bigger impact on market movements,” the report added.
加密貨幣交易員也保持謹慎。 Bitfinex 的一份報告顯示,8 月加密貨幣產業資本外流達 550 億美元。報告補充說,流動性下降導致孤立事件「對市場走勢產生更大影響」。
Will Bitcoin turn down and retest its pivotal support? Could Bitcoin’s weakness trigger further selling in altcoins? Let’s study the charts of the top 10 cryptocurrencies to find out.
比特幣會回落並重新測試其關鍵支撐嗎?比特幣的疲軟是否會引發山寨幣的進一步拋售?讓我們研究一下排名前十的加密貨幣的圖表來找出答案。
Join us in showcasing the cryptocurrency revolution, one newsletter at a time. Subscribe now to get daily news and market updates right to your inbox, along with our millions of other subscribers (that’s right, millions love us!) — what are you waiting for?
Bitcoin price analysis
訂閱與我們一起展示加密貨幣革命,一次一份時事通訊。立即訂閱,將每日新聞和市場更新直接發送到您的收件匣,以及我們數百萬其他訂閱者(沒錯,數以百萬計的人愛我們!) - 您還在等什麼?比特幣價格分析
Bitcoin broke and closed above the 20-day exponential moving average (EMA) of $26,228 on Sept. 14, indicating that the downside momentum is weakening.
9月14日,比特幣突破並收在20日指數移動平均線(EMA)26,228美元上方,顯示下行勢頭正在減弱。
The 20-day EMA is flattening out, and the relative strength index (RSI) is near the midpoint, signalling that the BTC/USDT pair may stay range-bound between $24,800 and $28,143 for some more time.
20 日均線趨於平緩,相對強弱指數 (RSI) 接近中點,顯示 BTC/USDT 貨幣對可能會在一段時間內保持在 24,800 美元至 28,143 美元之間的區間波動。
If bears want to make a comeback, they must quickly pull the price back below the 20-day EMA. Such a move will suggest that higher levels are being sold into. That could result in a retest of the strong support at $24,800.
如果空頭想要捲土重來,他們必須迅速將價格拉回20日均線下方。這樣的舉動將表明正在出售更高水準的股票。這可能會導致重新測試 24,800 美元的強勁支撐位。
Ether price analysis
以太幣價格分析
Ether plunged below the $1,550 support on Sept. 11, but the bears could not build upon this strength. This suggests solid buying at lower levels.
9 月 11 日,以太幣跌破 1,550 美元的支撐位,但空頭無法在此基礎上繼續走強。這表明較低水平上的強勁買盤。
The bulls after that started a recovery, which has reached the 20-day EMA ($1,638). This level will likely witness a tough battle between the bulls and the bears. A break and close above the 20-day EMA could trap several aggressive bears, resulting in a short squeeze. That could propel the price to $1,745.
此後多頭開始復甦,已觸及 20 日均線(1,638 美元)。這個水平可能會見證多頭和空頭之間的一場硬仗。突破並收於 20 日均線上方可能會困住一些激進的空頭,導致軋空。這可能會將價格推高至 1,745 美元。
Instead, if the price turns down from the 20-day EMA, it will suggest that the bears remain in command. The sellers will then make another attempt to sink the ETH/USDT pair below $1,550 and resume the downtrend.
相反,如果價格從 20 日均線下跌,則表示空頭仍占主導地位。然後,賣家將再次嘗試將 ETH/USDT 貨幣對跌破 1,550 美元並恢復下跌趨勢。
BNB price analysis
BNB價格分析
BNB bounced off the psychological support near $200 on Sept. 12, indicating that the bulls are active at lower levels.
BNB 於 9 月 12 日從 200 美元附近的心理支撐位反彈,表明多頭在較低水平活躍。
The recovery has reached the 20-day EMA ($215), a significant level to watch out for. If the BNB/USDT pair turns lower from the current level, it will indicate that the sentiment remains negative and traders are selling on relief rallies. That will increase the risk of a breakdown below $200.
復甦已達到 20 日均線(215 美元),這是一個值得關注的重要水平。如果 BNB/USDT 貨幣對從當前水準下跌,則表示市場情緒仍然消極,交易者正在逢高拋售。這將增加跌破 200 美元的風險。
Contrarily, the RSI is forming a positive divergence, indicating that selling pressure could be falling. A rise above the 20-day EMA could open the doors for a retest of the 50-day simple moving average (SMA) at $225.
相反,RSI 正在形成正背離,表明賣壓可能正在下降。如果升破 20 日均線,可能會為重新測試 225 美元的 50 日簡單移動平均線 (SMA) 打開大門。
XRP price analysis
瑞波幣價格分析
XRP has been trading between $0.41 and $0.56 for several days. The price has recovered to the 20-day EMA ($0.50), which is a significant level to keep an eye on.
XRP 幾天來一直在 0.41 美元至 0.56 美元之間交易。價格已恢復至 20 日均線(0.50 美元),這是一個值得關注的重要水平。
If buyers thrust the price above the 20-day EMA, it will indicate that the selling pressure is reducing. That could start a sustained recovery toward the overhead resistance at $0.56. This level may again act as a roadblock.
如果買家將價格推高至 20 日均線上方,則表示賣壓正在減輕。這可能會開始持續反彈至上方阻力位 0.56 美元。這一水平可能再次成為障礙。
If the price turns down from $0.56, it will indicate that the range-bound action may continue for some more time. The next trending move will likely begin after bulls push the price above $0.56 or bears sink the XRP/USDT pair below $0.41.
如果價格從 0.56 美元下跌,則表示區間波動可能會持續一段時間。下一個趨勢趨勢可能會在多頭將價格推高至 0.56 美元以上或空頭將 XRP/USDT 貨幣對壓至 0.41 美元以下之後開始。
Cardano price analysis
卡爾達諾價格分析
The strong selling in Cardano pulled the price to $0.24 on Sept. 11, but the bears could not break the crucial support.
9 月 11 日,卡爾達諾的強勁拋售將價格拉至 0.24 美元,但空頭無法突破關鍵支撐位。
The rebound off $0.24 on Sept. 12 reached the 20-day EMA ($0.26) on Sept. 15. This level is likely to witness a tussle between the buyers and sellers. If the ADA/USDT pair turns down sharply from the 20-day EMA, it will indicate that every minor rise is being sold. That could increase the risk of a drop to $0.22.
9 月 12 日從 0.24 美元反彈,並於 9 月 15 日觸及 20 日均線(0.26 美元)。這一水平可能會見證買家和賣家之間的鬥爭。如果 ADA/USDT 貨幣對從 20 日均線大幅下跌,則表示每次小幅上漲都被賣出。這可能會增加跌至 0.22 美元的風險。
Contrarily, if buyers shove the price above the 20-day EMA, it will signal the start of a more robust recovery to $0.28.
相反,如果買家將價格推高至 20 日均線上方,則將標誌著更強勁的復甦開始至 0.28 美元。
Dogecoin price analysis
狗狗幣價格分析
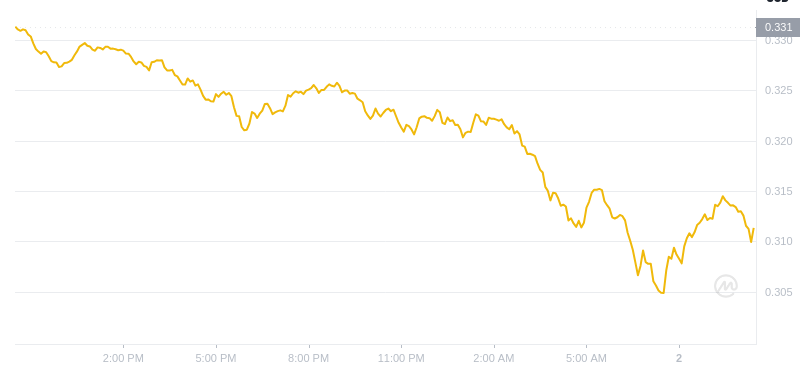
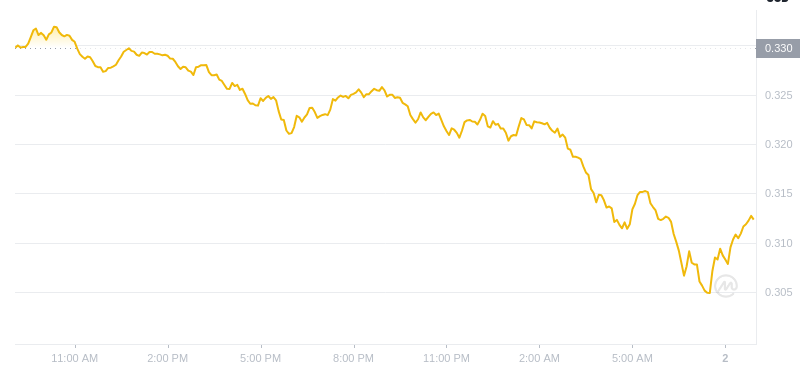
Dogecoin trades between the 20-day EMA ($0.06) and the solid support at $0.06. This tight-range trading is unlikely to continue for long, and a breakout may happen soon.
狗狗幣在 20 日均線(0.06 美元)和 0.06 美元的堅實支撐位之間交易。這種窄幅波動不太可能持續很長時間,突破可能很快就會發生。
If buyers kick the price above the 20-day EMA, it will suggest that the sellers may be losing their grip. That could start a relief rally to the 50-day SMA ($0.07), where the bears are expected to intensify selling.
如果買家將價格推至 20 日均線上方,則表示賣家可能會失控。這可能會引發反彈至 50 日移動平均線(0.07 美元),預計空頭將在此加劇拋售。
Contrary to this assumption, if the price turns down sharply from the 20-day EMA, it will enhance the prospects of a break below $0.06. The DOGE/USDT pair may plummet to $0.055 if this support breaks down.
與這一假設相反,如果價格從 20 日均線大幅下跌,則將增強跌破 0.06 美元的前景。如果該支撐位被打破,DOGE/USDT 貨幣對可能會暴跌至 0.055 美元。
Solana price analysis
Solana 價格分析
Solana’s SOL has been swinging between $14 and $27.12 for several months. The price has reached the 20-day EMA ($19.51), where bears will likely pose a stiff challenge.
幾個月來,Solana 的 SOL 一直在 14 美元到 27.12 美元之間波動。價格已達 20 日均線(19.51 美元),空頭可能會在此構成嚴峻挑戰。
If buyers thrust the price above the 20-day EMA, the SOL/USDT pair could reach the overhead resistance at $22.30. This level may again act as a substantial hurdle, but if bulls overcome it, the pair could climb to $27.12.
如果買家將價格推高至 20 日均線上方,SOL/USDT 貨幣對可能會觸及上方阻力位 22.30 美元。該水平可能再次成為一個重大障礙,但如果多頭克服它,該貨幣對可能會攀升至 27.12 美元。
On the contrary, if the price turns down from the 20-day EMA, it will signal that demand dries up at higher levels. The bears then try to resume the downtrend and yank the price to the vital support at $14.
相反,如果價格從 20 日均線下跌,則表示較高的需求枯竭。然後,空頭試圖恢復下跌趨勢,並將價格拉至 14 美元的重要支撐位。
Toncoin price analysis
通幣價格分析
Toncoin (TON) snapped back from the 20-day EMA ($1.75) on Sept. 12, indicating that the bulls view the dips as a buying opportunity.
Toncoin (TON) 於 9 月 12 日從 20 日均線(1.75 美元)反彈,表明多頭將逢低視為買入機會。
The price reached the first resistance at $1.98 on Sept. 13, when the bears tried to halt the up move. A minor advantage in favour of the bulls is that they have not ceded ground to the bears. This suggests that the bulls are in no hurry to book profits as they anticipate the upmove to continue.
9 月 13 日,價格觸及第一個阻力位 1.98 美元,當時空頭試圖阻止上漲走勢。有利於多頭的一個小優點是,他們沒有向空頭讓出陣地。這表明多頭並不急於獲利了結,因為他們預計漲勢將持續。
If the $1.98 level is removed, the TON/USDT pair could reach $2.07. This is essential for the bears to defend because a break above it could propel the pair to $2.40. On the downside, a slide below the 20-day EMA could tilt the advantage in favour of the bears.
如果移除 1.98 美元的水平,TON/USDT 貨幣對可能會達到 2.07 美元。這對於空頭的防禦至關重要,因為突破該水平可能會推動該貨幣對升至 2.40 美元。不利的一面是,跌破 20 日均線可能會使優勢向空頭傾斜。
Polkadot price analysis
波卡價格分析
Polkadot’s DOT has been trading below the breakdown of $4.22 for the past few days, which is a negative sign.
過去幾天 Polkadot 的 DOT 交易價格一直低於 4.22 美元,這是一個負面訊號。
The bulls are trying to start a relief rally, but that is likely to face strong selling at $4.22. If the price turns down from the overhead resistance, it will suggest that bears remain in control. The sellers will then try to sink the DOT/USDT pair below $3.90. If they succeed, the pair could collapse to $3.44.
多頭正試圖開始緩解反彈,但可能會面臨 4.22 美元的強勁拋售。如果價格從上方阻力位回落,則表示空頭仍處於控制之中。然後,賣家將嘗試將 DOT/USDT 貨幣對跌至 3.90 美元以下。如果他們成功,該貨幣對可能會跌至 3.44 美元。
Bulls must push and sustain the price above $4.22 if they want to prevent the decline. If they do that, it will suggest that the markets have rejected the breakdown. The pair may then attempt a rally to the 50-day SMA ($4.61).
如果多頭想要阻止下跌,就必須將價格推高並維持在 4.22 美元以上。如果他們這樣做,那就表示市場已經拒絕了崩盤。隨後該貨幣對可能會嘗試反彈至 50 日移動平均線(4.61 美元)。
Polygon price analysis
多邊形價格分析
Polygon’s MATIC slipped below the critical support at $0.51 on Sept. 11, but the bears could not maintain the selling pressure. That started a rebound, nearing the 20-day EMA ($0.54).
Polygon 的 MATIC 於 9 月 11 日跌破 0.51 美元的關鍵支撐位,但空頭無法維持拋售壓力。隨後開始反彈,接近 20 日均線(0.54 美元)。
The bears will attempt to stall the recovery at the 20-day EMA and tug the price below $0.50. If they manage to do that, it will signal the resumption of the downtrend. The MATIC/USDT pair could then slump to $0.45.
空頭將試圖阻止 20 日均線的復甦,並將價格拉至 0.50 美元以下。如果他們成功做到這一點,這將標誌著下跌趨勢的恢復。 MATIC/USDT 貨幣對可能會跌至 0.45 美元。
Although the downsloping moving averages indicate an advantage to bears, the positive divergence on the RSI suggests that the bearish momentum may be slowing down. If buyers clear the obstacle at the 20-day EMA, the pair may climb to $0.60.
儘管向下傾斜的移動平均線表明空頭具有優勢,但 RSI 的正背離表明看跌勢頭可能正在放緩。如果買家清除 20 日均線的障礙,該貨幣對可能會攀升至 0.60 美元。
Source
來源
資料來源:https://thebittimes.com/market-assessment-sep-15th-btc-eth-bnb-xrp-ada-doge-sol-ton-dot-matic-tbt62935.html


 Optimisus
 Optimisus
 DogeHome
 TheCoinrise Media
 TheCoinrise Media
 DogeHome
 Crypto Daily™
 U_Today
 Coinstelegram


