

Dogecoin Network Activity Shows Promising Signs
Dogecoin網絡活動顯示出有希望的跡象
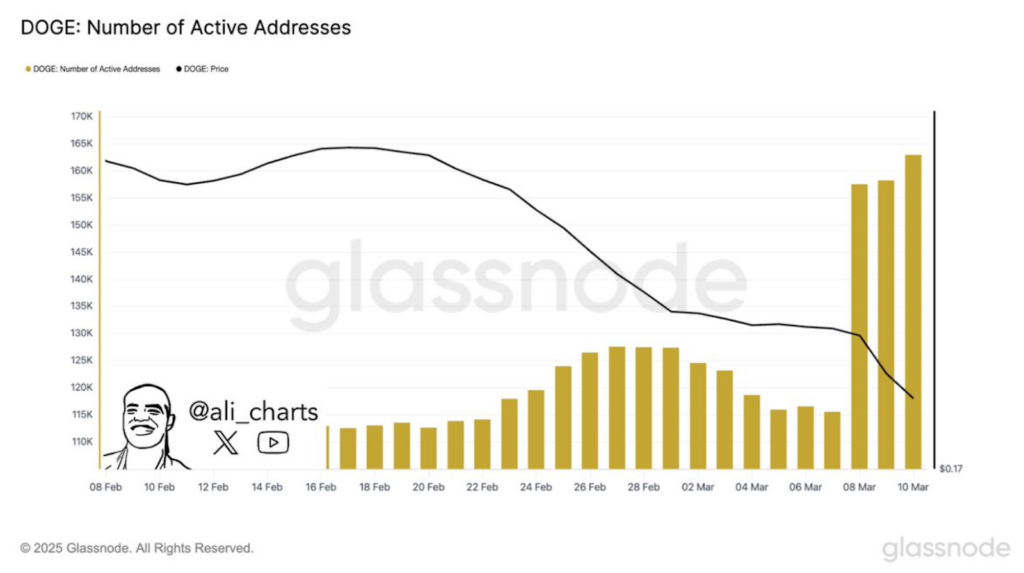
Dogecoin is exhibiting increased network activity, with a 47% surge in active addresses over the past month. This rise, from 110,000 to 163,000 active addresses, suggests growing user engagement and potential accumulation.
Dogecoin表現出增加的網絡活動,在過去一個月中,主動地址飆升了47%。 這一幅度從110,000到163,000個主動地址,表明用戶參與度和潛在積累越來越大。
Further fueling bullish sentiment is a pending SEC review of a Bitwise Dogecoin exchange-traded fund (ETF) proposal. Approval could significantly impact Dogecoin, providing easier access for institutional investors and potentially mirroring the price surge Bitcoin experienced following its ETF approval.
進一步加劇看漲的情緒是對Bitwise Dogecoin交換基金(ETF)提案的待定評論。 批准可能會極大地影響狗狗幣,為機構投資者提供更容易的機會,並有可能反映出其ETF批准後經歷的價格浪費。
Bullish Signals on Weekly Charts
每週圖表上看漲信號
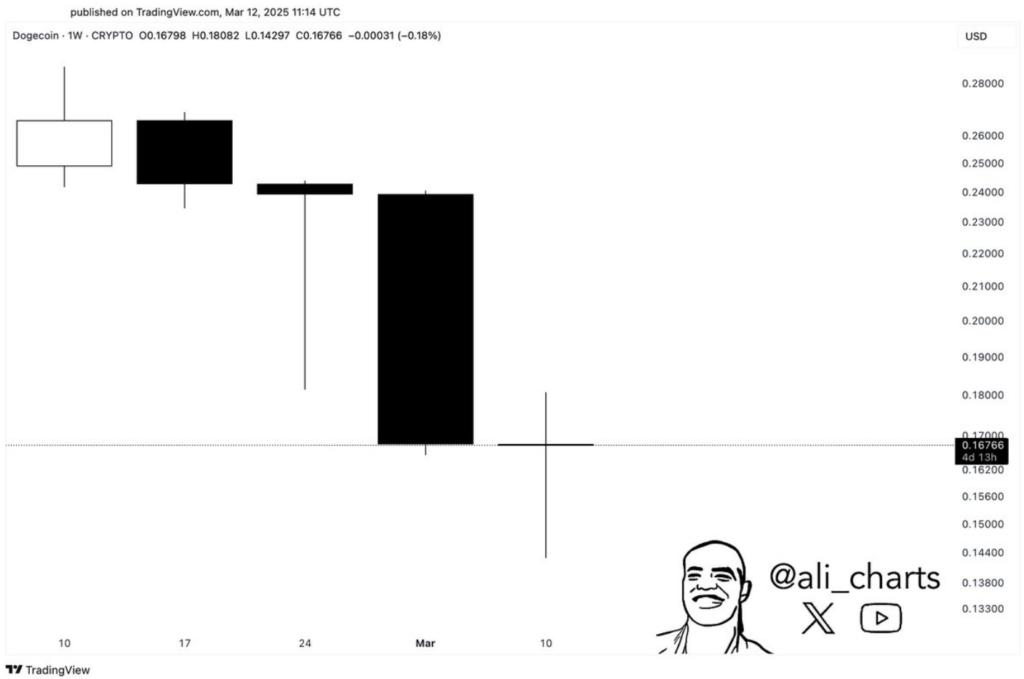
Technical analysis reveals a bullish reversal doji pattern on Dogecoin's weekly chart, suggesting a potential trend shift. The price recovery from $0.1429 to $0.1676 contributed to the formation of this pattern. Additionally, the price remains within a historically significant support zone, aligning with past performance where similar positions led to a 500% price increase.
技術分析顯示,在Dogecoin的每週圖表上,看漲的逆轉DOJI模式,這表明潛在的趨勢變化。 從0.1429美元到0.1676美元的價格回收促成了這種模式的形成。 此外,價格仍然在歷史上重要的支撐區域內,與過去的性能相吻合,在過去的表現中,相似的職位導致價格上漲了500%。
Futures Market Insights
期貨市場見解
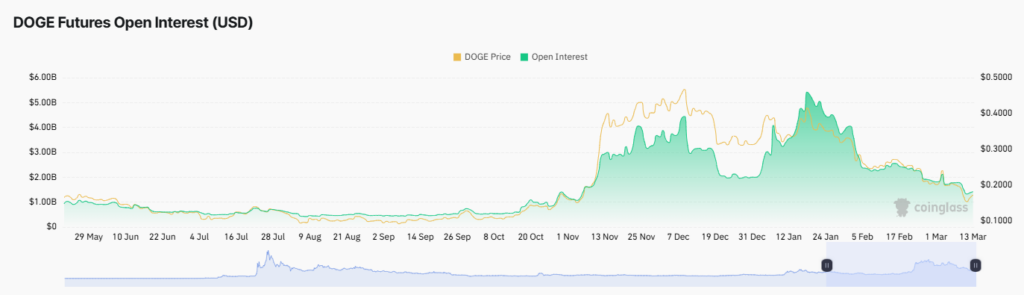
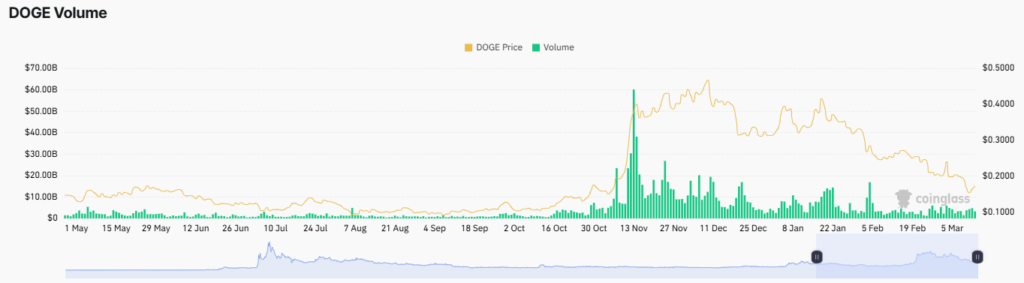
Dogecoin's futures market data, from CoinGlass, shows fluctuating open interest (OI) and trading volume. While OI peaked at over $5 billion in mid-January 2025, coinciding with a price between $0.40 and $0.50, it subsequently dropped to $1.3 billion in early March before recovering to $1.4 billion. Similarly, trading volume mirrored price movements, surging to nearly $60 billion in November 2024 when the price exceeded $0.40, before settling around $4 billion.
Dogecoin的期貨市場數據來自Coinglass,顯示出波動的開放興趣(OI)和交易量。 OI在2025年1月中旬達到頂峰,達到50億美元,與0.40至0.50美元的價格相吻合,隨後3月初下降至13億美元,然後恢復到14億美元。 同樣,交易量反映了價格變動,當價格超過0.40美元時,在2024年11月的價格上漲至近600億美元,然後達成40億美元。
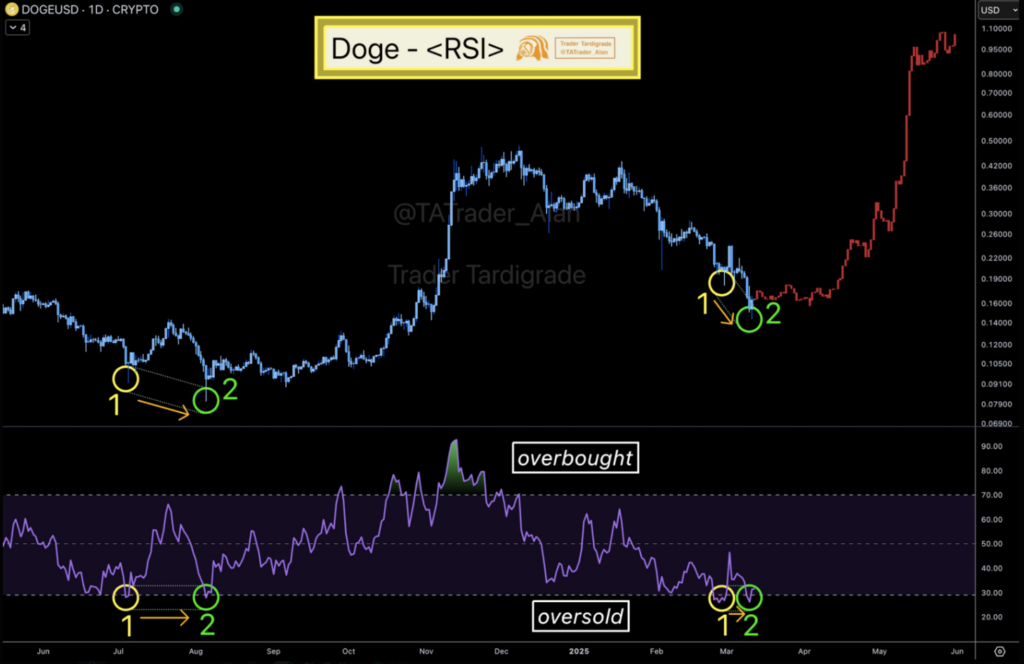
RSI Analysis Suggests Potential Bottom
RSI分析表明潛在的底部
Analyst Trader Tardigrade's RSI analysis points towards a classic bottoming pattern, similar to those observed in previous cycles. The RSI has fallen below 30, indicating potentially waning selling pressure. Furthermore, a bullish divergence pattern—where price makes a new low while the RSI shows minimal change—is present, mirroring a pattern that preceded a price doubling in July 2023. The current RSI of 30 suggests the possibility of upcoming price rallies.
分析師Trader Tardigrade的RSI分析指出了經典的底部模式,類似於以前的周期中觀察到的模式。 RSI降至30以下,表明銷售壓力可能會減弱。 此外,看漲的差異模式(價格在較低的情況下,RSI顯示最小的變化)存在於2023年7月的價格加倍之前的模式。當前30的RSI表明價格即將到來的價格集會的可能性。
The information presented here is for informational purposes only and does not constitute financial advice. Conduct thorough research before making any investment decisions.
此處提供的信息僅用於信息目的,不構成財務建議。 在做出任何投資決策之前,進行徹底的研究。
 Crypto Daily™
 DogeHome
 Cryptopolitan_News
 Times Tabloid
 Crypto News Land
 Crypto News Land
 London Insider


