

Dogecoin Network Activity Shows Promising Signs
Dogecoinネットワークアクティビティは、有望な兆候を示しています
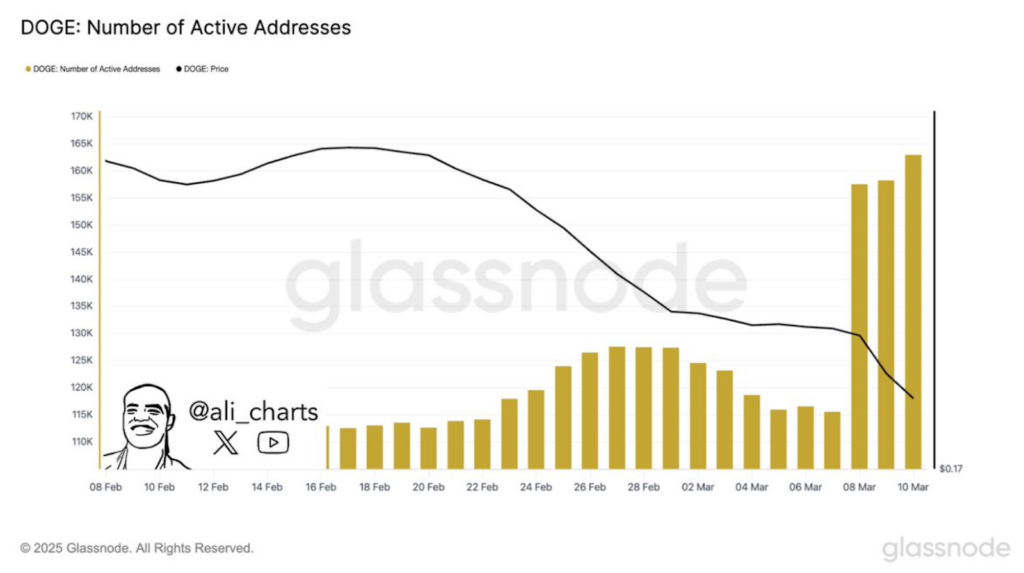
Dogecoin is exhibiting increased network activity, with a 47% surge in active addresses over the past month. This rise, from 110,000 to 163,000 active addresses, suggests growing user engagement and potential accumulation.
Dogecoinは、過去1か月間、アクティブアドレスが47%急増しているネットワークアクティビティの増加を示しています。 この上昇は、110,000から163,000のアクティブアドレスであり、ユーザーエンゲージメントの増加と潜在的な蓄積を示唆しています。
Further fueling bullish sentiment is a pending SEC review of a Bitwise Dogecoin exchange-traded fund (ETF) proposal. Approval could significantly impact Dogecoin, providing easier access for institutional investors and potentially mirroring the price surge Bitcoin experienced following its ETF approval.
強気の感情にさらに燃料を供給することは、ビットワイズドッグコインエクスチェンジトレードファンド(ETF)の提案の保留中のSECレビューです。 承認は、DogeCoinに大きな影響を与える可能性があり、機関投資家に容易なアクセスを提供し、ETFの承認後に経験したビットコインの価格サージを反映する可能性があります。
Bullish Signals on Weekly Charts
毎週のチャートの強気シグナル
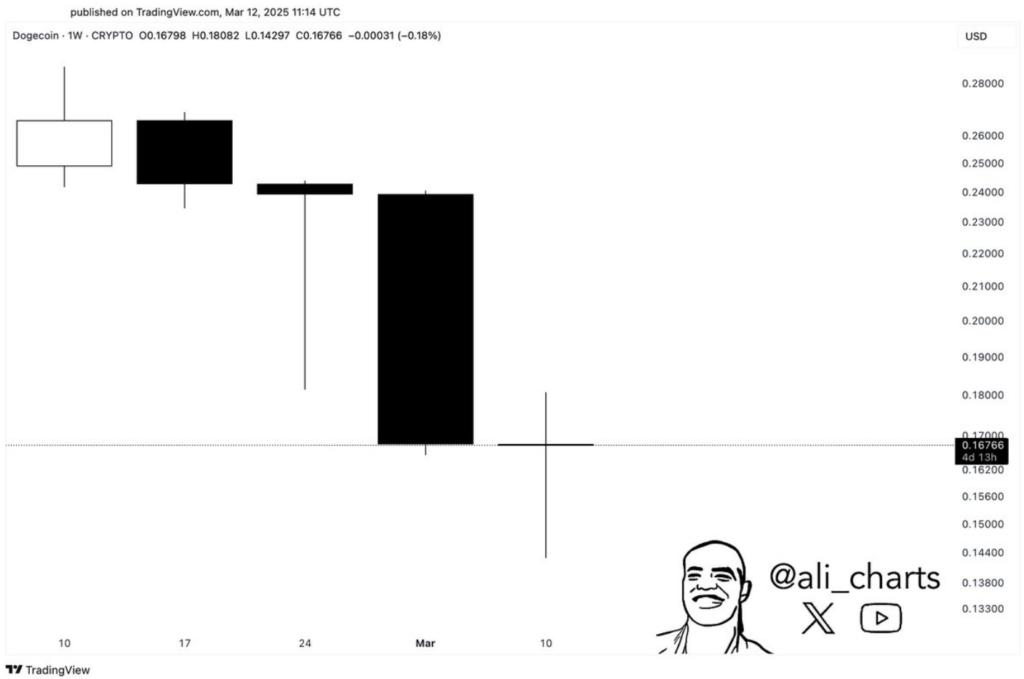
Technical analysis reveals a bullish reversal doji pattern on Dogecoin's weekly chart, suggesting a potential trend shift. The price recovery from $0.1429 to $0.1676 contributed to the formation of this pattern. Additionally, the price remains within a historically significant support zone, aligning with past performance where similar positions led to a 500% price increase.
テクニカル分析により、Dogecoinの毎週のチャートの強気の逆転dojiパターンが明らかになり、潜在的な傾向の変化が示唆されています。 0.1429ドルから0.1676ドルの価格回収は、このパターンの形成に貢献しました。 さらに、価格は歴史的に重要なサポートゾーン内に残り、同様のポジションが500%の価格上昇につながった過去のパフォーマンスに合わせています。
Futures Market Insights
先物市場の洞察
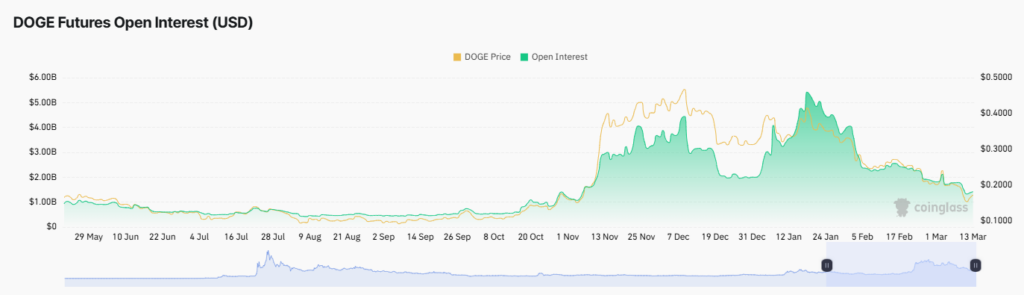
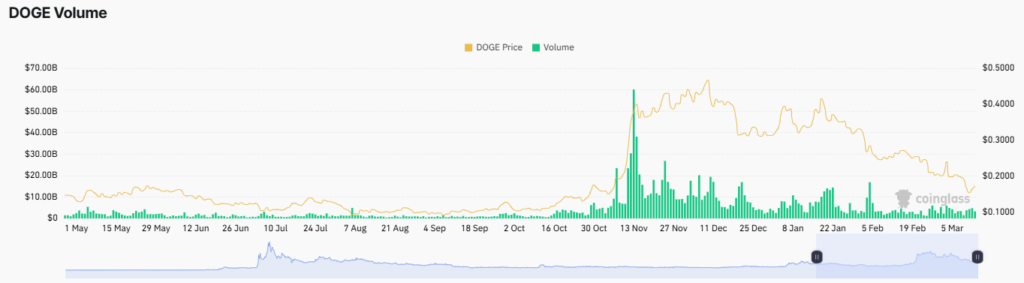
Dogecoin's futures market data, from CoinGlass, shows fluctuating open interest (OI) and trading volume. While OI peaked at over $5 billion in mid-January 2025, coinciding with a price between $0.40 and $0.50, it subsequently dropped to $1.3 billion in early March before recovering to $1.4 billion. Similarly, trading volume mirrored price movements, surging to nearly $60 billion in November 2024 when the price exceeded $0.40, before settling around $4 billion.
CoinglassからのDogecoinの先物市場データは、変動するオープン関心(OI)と取引量を示しています。 OIは2025年1月中旬に50億ドル以上でピークに達し、0.40ドルから0.50ドルの価格と一致しましたが、その後、3月上旬に13億ドルに減少し、14億ドルに回収されました。 同様に、取引量は価格の動きを反映しており、2024年11月に価格が0.40ドルを超えたときに約600億ドルに急増し、約40億ドルが決済しました。
RSI Analysis Suggests Potential Bottom
RSI分析は、潜在的な底部を示唆しています
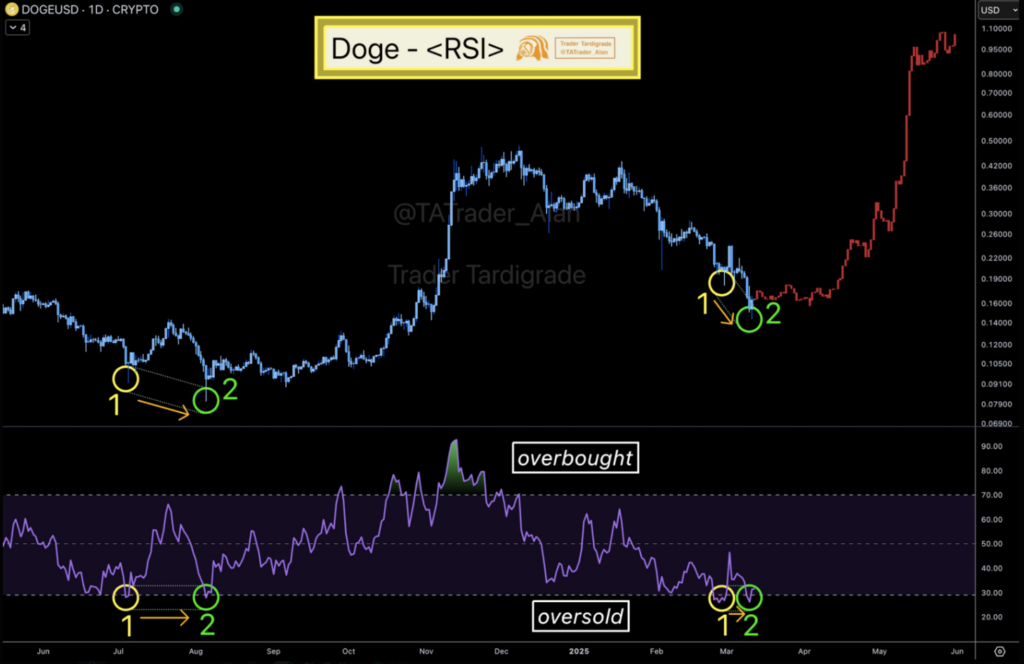
Analyst Trader Tardigrade's RSI analysis points towards a classic bottoming pattern, similar to those observed in previous cycles. The RSI has fallen below 30, indicating potentially waning selling pressure. Furthermore, a bullish divergence pattern—where price makes a new low while the RSI shows minimal change—is present, mirroring a pattern that preceded a price doubling in July 2023. The current RSI of 30 suggests the possibility of upcoming price rallies.
アナリストトレーダーのTardigradeのRSI分析は、以前のサイクルで観察されたものと同様に、古典的なボトムリングパターンを指し示しています。 RSIは30を下回っており、販売圧力が衰退する可能性があることを示しています。 さらに、RSIが最小限の変化を示す一方で、価格が低くなり、2023年7月に価格が2倍になったパターンを反映している強気の発散パターンは、新しい変化を示しています。現在のRSIは今後の価格集会の可能性を示唆しています。
The information presented here is for informational purposes only and does not constitute financial advice. Conduct thorough research before making any investment decisions.
ここに示されている情報は、情報提供のみを目的としており、財政的なアドバイスを構成していません。 投資決定を下す前に徹底的な調査を実施してください。
 Crypto Daily™
 DogeHome
 Cryptopolitan_News
 Times Tabloid
 Crypto News Land
 Crypto News Land
 London Insider


