Bitcoin (BTC) is back trading in the $69,000 price range, slightly below the psychological level of $70,000. On a volatile day, cryptocurrency traders look for insights on relevant support and resistance levels for the week.
比特币 (BTC) 回到 69,000 美元的价格区间,略低于 70,000 美元的心理水平。在波动较大的一天,加密货币交易者会寻找有关本周相关支撑位和阻力位的见解。
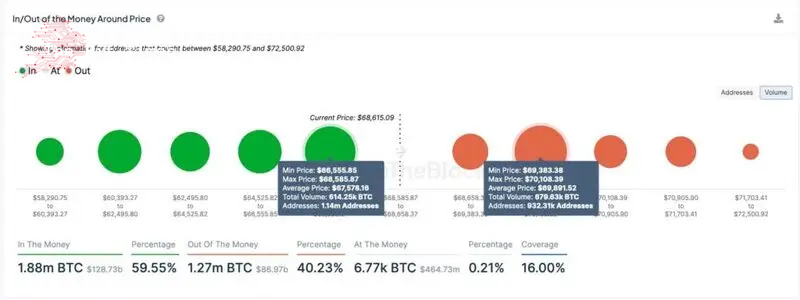
One way of spotting these key levels is by using on-chain data to identify price ranges with potential buying or selling pressure. In particular, IntoTheBlock provides data on the Bitcoin volume that is “in or out of the money,” on April 10.
发现这些关键水平的一种方法是使用链上数据来确定具有潜在买卖压力的价格范围。特别是,IntoTheBlock 提供了 4 月 10 日“货币内或货币外”的比特币交易量数据。
For example, the 614,250 BTC kept by 1.14 million addresses can form support between $66,555 and $68,585, averaging $67,578 per Bitcoin. This is because investors who previously purchased at these prices are currently profitable and likely to repeat the strategy.
例如,114万个地址保存的614,250个比特币可以在66,555美元至68,585美元之间形成支撑,平均每个比特币为67,578美元。这是因为之前以这些价格购买的投资者目前是有利可图的,并且可能会重复该策略。
Picks for you
为您精选
机器学习算法设定 2024 年 4 月 30 日狗狗币价格 2 小时前
比特币最后一次看涨:2小时前,BTC在抛物线反弹前发出买入信号
周五 3 小时前解锁 3 亿美元代币,引发大规模抛售警报
Portofino Technologies 加入 Pyth Network 作为新数据提供商 4 小时前
On the other hand, Bitcoin has significant selling pressure on the $69,891 average price, potentially forming resistance. There are 679,630 BTC out of the money between $69,383 and $70,108. Therefore, the 923,310 addresses holding this currently unrealized loss could be encouraged to sell and break even in this range.
另一方面,比特币对 69,891 美元的均价存在巨大的抛售压力,可能形成阻力。 69,383 美元到 70,108 美元之间有 679,630 个 BTC。因此,持有当前未实现亏损的 923,310 个地址可能会被鼓励在此范围内卖出并实现盈亏平衡。

BTC support and resistance price analysis
BTC支撑位和阻力位价格分析
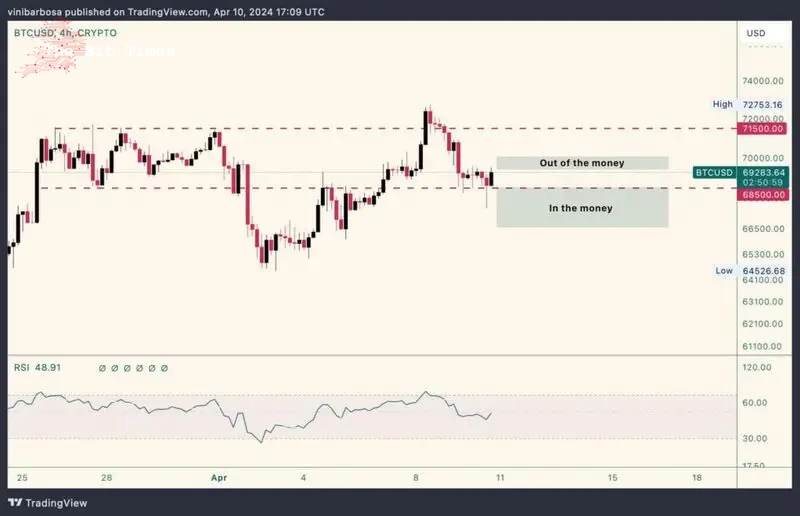
Interestingly, the on-chain support zone is aligned with technical Analysis support at $68,500, at the bottom of a trading range. During today’s dip, Bitcoin briefly lost its range, just to quickly retrace inside of it again.
有趣的是,链上支撑区域与技术分析支撑位 68,500 美元保持一致,位于交易区间的底部。在今天的下跌过程中,比特币短暂失去了区间,但很快又回到了区间内。
As a result, BTC tested and validated the aforementioned expected buying pressure within the “in the money” volume. Particularly trading as low as $67,500, on the averaging price support we previously observed.
因此,BTC 在“价内”交易量内测试并验证了上述预期购买压力。特别是在我们之前观察到的平均价格支撑下,交易价格低至 67,500 美元。

Now, investors must watch for both levels, as they could tighten Bitcoin’s trading range, or provide valuable buy and sell signals in case BTC breaks any of them. Potentially moving to the following supports and resistances. As of writing, Bitcoin trades at $69,283 and a breakout to the upside could test the range’s top at $71,500.
现在,投资者必须关注这两个水平,因为它们可能会收紧比特币的交易区间,或者在比特币突破其中任何一个水平时提供有价值的买卖信号。可能会移动至以下支撑位和阻力位。截至撰写本文时,比特币交易价格为 69,283 美元,向上突破可能会测试该区间的顶部 71,500 美元。
Disclaimer: The content on this site should not be considered investment advice. Investing is speculative. When investing, your capital is at risk.
免责声明:本网站的内容不应被视为投资建议。投资是投机性的。投资时,您的资本面临风险。
Source: https://thebittimes.com/bitcoin-support-and-resistance-levels-to-watch-this-week-tbt85040.html
资料来源:https://thebittimes.com/bitcoin-support-and-resistance-levels-to-watch-this-week-tbt85040.html


 DogeHome
 U_Today
 U_Today
 Optimisus
 Crypto Front News
 Cointribune
 CoinPedia News
 CoinoMedia


