Bitcoin (BTC) is back trading in the $69,000 price range, slightly below the psychological level of $70,000. On a volatile day, cryptocurrency traders look for insights on relevant support and resistance levels for the week.
ビットコイン(BTC)は心理的な水準である7万ドルをわずかに下回る6万9000ドルの価格帯で取引されている。不安定な日には、仮想通貨トレーダーはその週の関連する支持線と抵抗線のレベルに関する洞察を求めます。
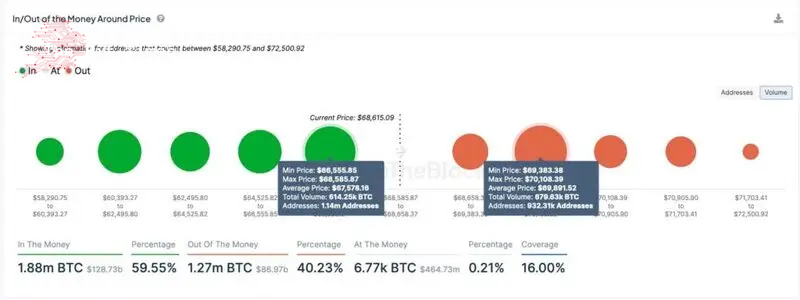
One way of spotting these key levels is by using on-chain data to identify price ranges with potential buying or selling pressure. In particular, IntoTheBlock provides data on the Bitcoin volume that is “in or out of the money,” on April 10.
これらの重要なレベルを特定する 1 つの方法は、オンチェーン データを使用して、潜在的な買い圧力または売り圧力のある価格帯を特定することです。特に、IntoTheBlock は、4 月 10 日のビットコインの「資金の出入り」に関するデータを提供します。
For example, the 614,250 BTC kept by 1.14 million addresses can form support between $66,555 and $68,585, averaging $67,578 per Bitcoin. This is because investors who previously purchased at these prices are currently profitable and likely to repeat the strategy.
たとえば、114 万のアドレスによって保持される 614,250 BTC は、66,555 ドルから 68,585 ドルの間のサポートを形成でき、ビットコインあたり平均 67,578 ドルになります。これは、以前にこれらの価格で購入した投資家が現在利益を上げており、この戦略を繰り返す可能性が高いためです。
Picks for you
あなたにおすすめ
機械学習アルゴリズムがドージコインの価格を2024年4月30日に設定 2 時間前
ビットコインのラストコール:放物線ラリーの前にBTCが買いシグナルを提示 2時間前
3時間前の金曜日、3億ドルのトークンロック解除中、大規模な売却警告
Portofino Technologies が新しいデータプロバイダーとして Pyth Network に参加 4 時間前
On the other hand, Bitcoin has significant selling pressure on the $69,891 average price, potentially forming resistance. There are 679,630 BTC out of the money between $69,383 and $70,108. Therefore, the 923,310 addresses holding this currently unrealized loss could be encouraged to sell and break even in this range.
一方、ビットコインには平均価格69,891ドルに対して大きな売り圧力がかかっており、抵抗線を形成する可能性がある。 69,383ドルから70,108ドルまでのお金のうち、679,630BTCがあります。したがって、現在この含み損を抱えている 923,310 のアドレスは、この範囲内で売却して損益分岐点にすることが奨励される可能性があります。

BTC support and resistance price analysis
BTCサポートとレジスタンス価格分析
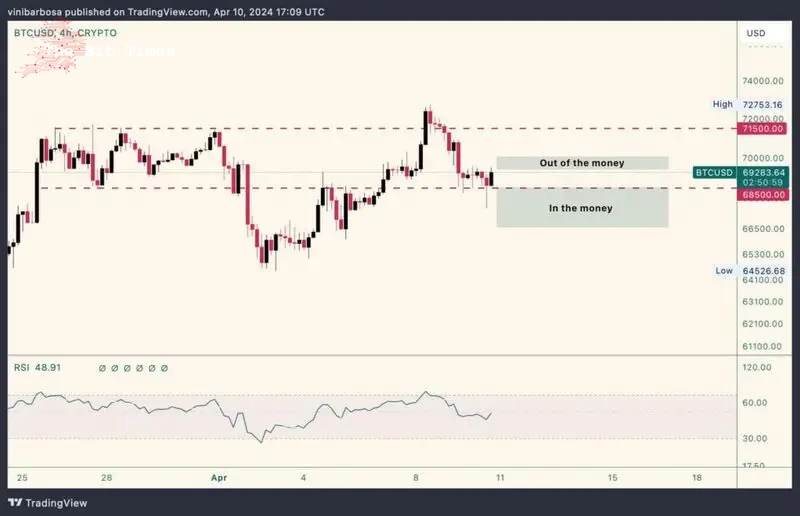
Interestingly, the on-chain support zone is aligned with technical Analysis support at $68,500, at the bottom of a trading range. During today’s dip, Bitcoin briefly lost its range, just to quickly retrace inside of it again.
興味深いことに、オンチェーンサポートゾーンは、取引範囲の底値である68,500ドルでテクニカル分析サポートと一致しています。今日の下落中、ビットコインは一時的にレンジを失いましたが、すぐに再びレンジ内に戻りました。
As a result, BTC tested and validated the aforementioned expected buying pressure within the “in the money” volume. Particularly trading as low as $67,500, on the averaging price support we previously observed.
その結果、BTC は「イン・ザ・マネー」の量内で前述の予想される購入圧力をテストし、検証しました。特に、以前に観察した平均価格サポートに基づいて、67,500ドルという低価格で取引されています。

Now, investors must watch for both levels, as they could tighten Bitcoin’s trading range, or provide valuable buy and sell signals in case BTC breaks any of them. Potentially moving to the following supports and resistances. As of writing, Bitcoin trades at $69,283 and a breakout to the upside could test the range’s top at $71,500.
現在、投資家は両方のレベルに注意する必要があります。なぜなら、ビットコインの取引範囲が狭まる可能性、あるいはBTCがいずれかのレベルをブレイクした場合に貴重な売買シグナルを提供する可能性があるからです。次のサポートとレジスタンスに移動する可能性があります。執筆時点では、ビットコインは69,283ドルで取引されており、上値を突破すれば71,500ドルの範囲の上限を試す可能性があります。
Disclaimer: The content on this site should not be considered investment advice. Investing is speculative. When investing, your capital is at risk.
免責事項: このサイトのコンテンツは投資アドバイスとみなされるべきではありません。投資は投機的なものです。投資する場合、資本はリスクにさらされます。
Source: https://thebittimes.com/bitcoin-support-and-resistance-levels-to-watch-this-week-tbt85040.html
出典: https://thebittimes.com/bitcoin-support-and-resistance-levels-to-watch-this-week-tbt85040.html


 DogeHome
 Optimisus
 Crypto News Land
 Optimisus
 Cryptopolitan_News
 Cryptopolitan
 crypto.ro English


