

Dogecoin's decline to $0.17152 suggests a bearish trend, with $0.16801 serving as a crucial support level. Historical trends indicate a potential rebound if buyers maintain their position above this support. Analysts monitor price and volume fluctuations to determine the overall trend.
Dogecoin的下跌至0.17152美元,这表明是看跌趋势,0.16801美元是至关重要的支持水平。 历史趋势表明,如果买家将自己的位置保持在此支持之上,则可能会反弹。 分析师监视价格和数量波动以确定总体趋势。
Since its peak of $0.45 in December 2024, Dogecoin has experienced a gradual decline, reaching $0.17152 as of March 17, 2025. This downtrend, marked by lower highs and lows, has established $0.16801 as a key support level, previously acting as resistance in mid-2024.
自2024年12月的峰值达到0.45美元以来,Dogecoin逐渐下降,截至2025年3月17日达到0.17152美元。这种下降趋势以较低的高高和低点为标志,已确立了0.16801美元,已确立了$ 0.16801,作为主要的支持水平,以前是Mid-2024中的抵抗力。
Market Trends and Price Activity
市场趋势和价格活动
Dogecoin's price action in 2024 initially exhibited a period of consolidation, characterized by minimal price fluctuations from May to October. This period of stability ended with a rapid price surge to its December peak, followed by a sharp decline in early 2025.
Dogecoin在2024年的价格行动最初表现出一段合并时期,其特征是从5月到10月,价格的波动最小。这一稳定时期以迅速的价格上涨到12月的高峰结束,随后在2025年初下降。
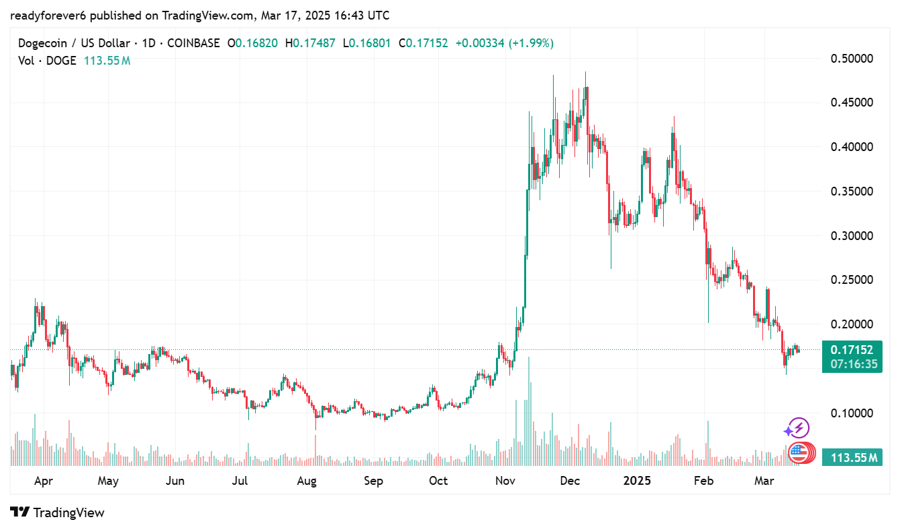
Source: TradingView
资料来源:TradingView
Long lower wicks in recent candlestick patterns suggest significant buying interest near current levels. Holding the $0.16801 support level could lead to stabilization and a return to buyer control. Conversely, a breach below this level could trigger further losses and extend the bearish trend.
在最近的烛台模式中,较长的较低的灯芯表明,当前水平附近的重大购买兴趣。 保持$ 0.16801的支持水平可能会导致稳定和返回买方控制。 相反,低于此水平的违规行为可能会引发进一步的损失并扩大看跌趋势。
This market behavior mirrors previous cycles where strong support zones have facilitated price reversals. Analysts believe sustained buying pressure at current levels could initiate a recovery. A break above resistance levels could signal a return to bullish momentum in the coming weeks.
这种市场行为反映了以前的周期,强大的支持区有助于价格逆转。 分析师认为,当前水平的持续购买压力可能会引发恢复。 超过电阻水平的突破可能意味着在接下来的几周内恢复了看涨势头。
Historical Patterns and Potential Reversal
历史模式和潜在的逆转
DogecoinCapital's analysis of long-term price movements (2014-2025) using Heikin Ashi candlesticks revealed recurring cycles of accumulation, breakout, and retracement within an ascending price channel. Historically, declines have been followed by recoveries.
Dogecoincapital对Heikin Ashi Candlesticks对长期价格变动的分析(2014-2025)揭示了在上升的价格渠道内反复出现的积累,突破和回撤。 从历史上看,随之而来的是恢复。
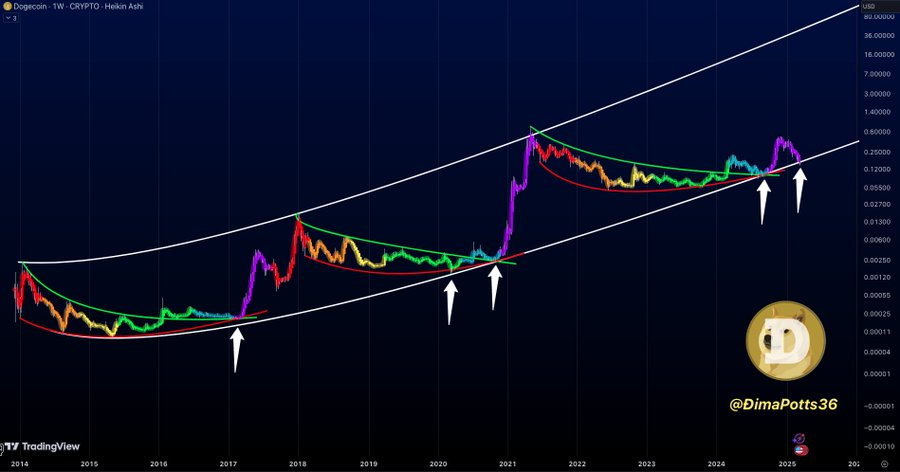
Source: DOGECAPITAL
资料来源:Dogecital
DogecoinCapital's analysis indicates that accumulation at the channel's lower boundary frequently precedes significant price increases. The current price action resembles previous accumulation phases, hinting at a potential rebound if demand increases.
Dogecoincapital的分析表明,该通道下部边界的积累经常在价格上涨之前。 当前的价格行动类似于以前的累积阶段,暗示如果需求增加,则可能会反弹。
However, failure to maintain the $0.16801 support level could prolong the downturn. Analysts are closely monitoring trading volume and technical indicators to assess buyer commitment at critical support levels. The market's trajectory hinges on Dogecoin's ability to maintain key support or succumb to further price declines.
但是,无法维持$ 0.16801的支撑水平可能会延长经济下滑。 分析师正在密切监视交易量和技术指标,以评估关键支持水平的买方承诺。 该市场的轨迹取决于Dogecoin保持关键支持或屈服于进一步价格下降的能力。
 BlockchainReporter
 Cryptopolitan_News
 Cryptos Newss
 DogeHome
 CFN
CFN Optimisus


